by Tanya HAFFNER | May 2, 2018 | Thoughts
This week in the news there are reports on whether coffee consumption in pregnancy could increase the chances of having an overweight child. This was picked up by the Daily Mail, The Telegraph and The Express.
The report is based on a study published this month in the British Medical Journal where it was found that any caffeine consumption during pregnancy was associated with a higher risk of excess infant growth and of being overweight in childhood.
Our opinion in brief
The study has limitations. It was not controlled and being a single study alone, we cannot say there is conclusive evidence to support the theory that drinking coffee in pregnancy leads to overweight children.
Nevertheless, current advice for pregnant women is to avoid high intakes of caffeine and stick to no more than 200mg per day.
Details of the study and findings
- 51,000 mother and infant pairs in Norway between 2002 and 2008 were studied.
- Expectant mother’s daily intake of caffeine (found in coffee, chocolate, tea and soft drinks) was measured at 22 weeks of pregnancy.
- The results were divided into the following categories:
- 1) ‘Low caffeine intake’ – less than 50mg/day (equivalent of half a cup of coffee/two thirds of a cup of tea) just less than 50% were in this group.
- 2) ‘Average caffeine intake’ – 50-199mg/day (equivalent of up to two cups of coffee/tea per day), over 40% were in this group.
- 3) ‘High caffeine intake’ – 200-299mg/day (equivalent of up to three cups of coffee/four cups of tea per day), 7% were in this group.
- 4) ‘Very high caffeine intake’ – more than 300mg/day (equivalent of three or more cups of coffee/four or more cups of tea per day), 3% were in this group.
- Children’s weight and height were measured at six weeks of age, at three, six, eight, 12 and 18 months and then at two years and every year thereafter up to the age of eight.
- The prevalence of excess growth in infancy increased from 23% to 29% as prenatal caffeine intake increased from low to very high.
- The prevalence of overweight increased by 5% at age 3 years, by 6% at age 5 years and by 3% at age 8 years with increasing prenatal caffeine exposure from low to very high.
The original study shows all the detailed findings.
Behind the headlines: the Nutrilicious dietetic view
What do we know already about caffeine in pregnancy?
High intakes of caffeine during pregnancy (more than 200mg per day or two cups of coffee or tea) can result in low birth weight babies, which can increase the chances of health problems in later life. Too much caffeine can also cause a miscarriage.
Source: National Health Service
The study, however, focuses on excessive weight gain during infancy and childhood, which is currently not a known effect associated with high caffeine intakes. We must consider the strengths and weaknesses of this study.
Strengths and weaknesses of the study
Strengths include the very large sample size on which the study was based (51,000 mother-child pairs) and also that maternal caffeine intake was estimated from all possible food sources (not just coffee).
A major weakness of the study, as with many other dietary studies, is that the data is self-reported. It relies on the honesty and accuracy of the mother reporting their caffeine intake. Additionally, measurements of height and weight after 2 years were self-reported by the mother, again reducing the accuracy of the findings.
Importantly, this study was not a controlled trial and thus we cannot prove or be certain that the caffeine intake during pregnancy was the cause of the children being overweight. There are many factors which could interfere with the results including the other attributes or lifestyles and dietary choices that the mothers may have that were in the high caffeine intake groups.
For example, it was reported that women who were in the ‘high caffeine intake’ group were more likely to have been obese before pregnancy and to have partners who were obese and smokers.
Current advice
We would strongly advise that pregnant women stick to the advice from the Foods Standards Agency, which is to limit caffeine to no more than 200mg per day.
This is equivalent to about
- two mugs of instant coffee (100mg each)
- one mug of filter coffee (140mg each)
- two mugs of tea (75mg each)
- five cans of cola (up to 40mg each)
- two cans of energy drinks (up to 80mg each) or
- four (50g) bars of plain chocolate (up to 50 mg each).
Many of the headlines focus on coffee even though, as shown above, other food and drinks contain caffeine. All sources of caffeine should be considered and to ensure maximum limits are not exceeded.
by Tanya HAFFNER | Apr 27, 2018 | The Nation’s Health
The new sugar tax on soft drinks excludes fruit juices, as they are legally labelled as having ‘no added sugar’. With child obesity levels ever-increasing, especially among lower socio-economic groups, this worries us.
It also highlights the increasingly frequent and often damaging disconnect between legislation, nutrition science and public health guidance.
Fruit juice is a liquid form of ‘free sugars’, with little of the fibre naturally found in fruit. Additionally, some of the essential vitamins present in fruit juice such as B vitamins, folate and vitamin C are added to fruit juice at the end of processing. So the perception of it as a ‘naturally healthy’ drink is misleading.
Here’s why and when we’re concerned about fruit juice…
Confusing labelling: no added sugar, one of your five a day
‘Added’ vs ‘free’ sugars
With fruit juice packaging labelled with ‘no added sugars’ and the government’s ‘counts as one of your five a day,’ it’s not surprising that consumers perceive fruit juice as better for you than sweetened soft drinks.
EU law permits 100% fruit juice that does not contain any other forms of ‘added sugars’ to be labelled as having ‘no added sugars’.
That sounds logical, right? Except it clashes with the World Health Organisation (WHO) and Public Health England (PHE), who both classify fruit juice as a source of ‘free’ sugars. This is because structure of the fruit has been broken down to release sugars in their free form, which behave in the same way in the body as other forms of more commonly understood ‘free’ sugars, for example table sugar. Like fruit juice, table sugar is simply a result of extracting/freeing naturally occurring sugars from the structure of the beet or cane plant.
The most recent PHE publication in March this year makes things crystal clear, ‘[Free sugars are] all monosaccharides and disaccharides added to foods by the manufacturer, cook or consumer, plus sugars naturally present in honey, syrups and unsweetened fruit juices’.
Vitamins, minerals and fibre in fruit juice
Despite this clear scientific reasoning on sugar, PHE continues to permit 150ml daily allowance of fruit juice to count as one of your five a day.
This is based on the fact that the UK continues to under-consume whole fruit and vegetables, which are critical to meet our essential vitamin C and potassium requirements.
150ml orange juice is equivalent to a medium orange for vitamins, minerals and total sugars. It will provide vitamin C in excess of our requirements and 7-30% of our potassium needs (depending on age), plus vitamin B1 (thiamine). However:
- Fibre: fruit juice 0.1 – 0.9g per 150ml (even one with ‘bits’) vs a medium orange at 1.9g.
- Free sugars: fruit juice 12.3g vs none in a medium orange.
The truth about fruit juice sugars
In terms of free sugars, weight for weight there’s little difference between fruit juice and soft drinks.
|
Amount of free sugars |
% daily free sugars max. recommendations |
| 2-3 yr olds (14g) |
4-6 yr olds
(19g) |
7-10 yr old
(24g) |
11 yr olds and older
(30g) |
| 1 medium (160g) orange |
0 |
0% |
0% |
0% |
0% |
| 150ml pure orange juice |
12.3g |
88% |
65% |
51% |
41% |
| 150ml cola drink |
16.4g |
117% |
86% |
68% |
55% |
| 150ml lemonade |
8.7g |
62% |
46% |
36% |
29% |
Studies looking at fruit juice intakes and impact on health proved challenging for SACN when reviewing their recommendations. Evidence for fruit juice and impact on health was found to be lacking, inconsistent and / or of poor quality.
The problem of portion size
If everyone was to keep to 150ml of a sweetened liquid per day, there would be no issue with fruit juice or sweetened beverages. The problem is, this official advice is given to a nation where it has been found that only 1% of the UK population achieve healthy eating recommendations.This 150ml of sweetened liquid per day will in reality not be followed or achieved by the majority. Not least because it’s difficult to keep to 150ml of fruit juice when, in the main, it is sold in 200ml and 1litre cartons, and most household glasses are around 200-250ml.
Fruit juice is the top contributor to free sugars’ intake for young people
According to the government’s 2018 National Diet and Nutrition Survey, fruit juice remains the number one free sugars contributor for 1½ to 10 year olds. This is highly indicative of mum’s perception that fruit juice, unlike sweetened soft drinks, is ‘natural’, has ‘no added sugars’ and therefore good for their children.
During teen years, sweetened beverages takes prominent first place. Fruit juice drops down to third position but still contributing to almost 10%.
Dental decay
It’s not just weight that’s an issue. The UK has one of the highest incidence of dental caries globally. Dental health is dependent on multiple factors, including the frequency and timing of sugar consumption and length of time teeth and gums are exposed to acidic and sugary foods.
Both fruit juice and sweetened beverages are acidic and contain large amounts of ‘free sugars’. They are therefore not recommended by the British Dental Association (BDA). If fruit juice is to be consumed, the BDA recommends diluting it – 1 part juice to 10 parts water. Despite a common misconception around whole fruit, the BDA highlights that fruit, although acidic, is not a risk to dental health except when consumed in unusually large quantities.
The bottom line is that consumers need to be aware that there is little difference between sweetened beverages and fruit juice when it comes to tooth decay. The recommended drink by all health organisations is either water or milk for optimum health.
What would we like to see?
Free sugars are not essential for human health. Due to our over-consumption, they have become a major contributor to our calorie over-consumption.
However, it would be unrealistic to avoid them altogether, and if consumed in moderation as part of a healthy, balanced diet and lifestyle, there should be no problem at all. The government has set maximum recommended intakes for all ages.
- 0-1 year = no free sugars should be introduced
- 2-3 years = no more than 14g / 3½ tsp per day
- 4-6 years = no more than 19g / 4½ tsp per day
- 7-10 years = no more than 24g / 6 tsp per day
- 11 years plus = no more than 30g / 7 tsp per day
In the context of the current health state of our nation, consumers are struggling with the ‘in moderation’ and ‘balanced diet’ (otherwise obesity and obesity-related diseases would not continue to escalate).We are at crisis point with our unhealthy choices, which are having untold preventable health and economic impacts.
People need clearer advice and support to stop over-consumption and have a healthier understanding and relationship with food and drink.
When it comes to fruit juice, we believe it’s time to start promoting the benefits of consuming real fruit, which provide so much more nutrition, contain no free sugars and very unlikely to be over-consumed.
The law should change to take into consideration international and national classifications of ‘free’ and ‘added’ sugars.
What do you think? Join our discussion on LinkedIn
by Tanya HAFFNER | Apr 16, 2018 | Hot Topics in nutrition, The Nation’s Health
This month, the much anticipated sugar tax came into force in the UK. So what it is, why was it introduced and – most importantly – will it have any impact?
The tax
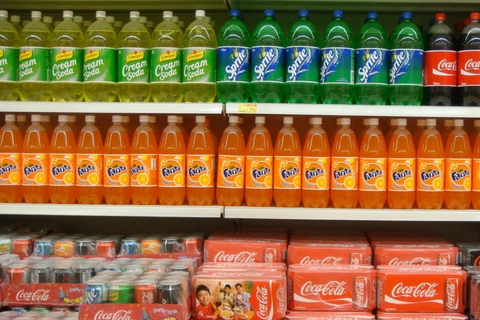
Soft drinks companies are now required to pay a levy on drinks with certain levels of added sugar:
- 18p per litre of drink if the product contains more than 5g of sugar per 100ml
- 24p per litre if it contains 8g of sugar per 100ml.
The tax does not apply to milk-based drinks, due to their calcium content. It also excludes fruit juice or vegetable juice that don’t have added sugar.
Foods such as cakes, biscuits and other sugar containing foods aren’t covered, but there is a separate initiative to reduce their sugar content by 20% by 2020.
Why was it introduced?
The tax has been introduced in an effort to tackle childhood obesity. The latest National Diet and Nutrition Survey (NDNS) showed that sugar-sweetened drinks are the single highest source of free sugars for children and teenagers. This is why soft drinks have been targeted.
Action already taken by the industry
An estimated 50 per cent of manufacturers have already reduced the sugar content of their drinks to avoid the new tax, including leading brands:
- Fanta – reduced sugar from 6.9g (a little under 2 tsp) to 4.6g (just over 1 tsp) per 100ml.
- Ribena – from 10g (2.5 tsp) to less than 4.5g (just over 1 tsp) per 100ml.
- Lucozade – from 13g (just over 3 tsp) to less than 4.5g (just over 1 tsp) per 100ml.
- Irn Bru – from 10.3g (2.5 tsp) to 4.7g (just over 1 tsp) per 100ml.
Others remain the same, for example Coca-Cola (10.6g per 100ml, just over 2.5 tsp) and Pepsi (11g per 100ml, just under 3 tsp). These manufacturers have to decide whether to bear the cost of the tax increase themselves, or pass it on to consumers.
In one leading supermarket, the cost of a 2L bottle of Pepsi went up by 45p when the tax was introduced. By contrast, Coca Cola kept the price the same but reduced the portion size: a 1.75L bottle has shrunk to 1.5L bottle.
Will it work?
A survey by Mintel of 2,000 people found that just under half (47%) of Brits say that a tax making unhealthy food or drink more expensive would encourage them to cut down on these items. So the measure will hopefully have some effect.
It’s extremely positive that some food manufacturers have already taken action to reduce the sugar content of their recipes. However, the feedback hasn’t always been positive about the new taste of much-loved products (reduced sugar Lucozade and Irn Bru, for example). And a significant proportion of people will simply pay more for the same recipe high-sugar drink they’ve always enjoyed.
We’re also concerned that drinks that fell outside of taxable products, such as fruit juice, often still have high levels of free sugars. The National Health Service discusses maximum intakes of free sugars for all ages.
What happens now?
Drinks manufacturers have made an initial decision on whether to reduce sugar levels to avoid the new taxation or to leave sugar levels unaltered. They’ll be closely monitoring orders from retailers to assess the effectiveness of their initial decision. If it proves that sales of reduced-sugar drinks increases, other manufacturers may be keen to follow suit.
Drinks retailers will need to carefully monitor demand for those reduced-sugar drinks vs unaltered recipes that are subject to the tax, to satisfy any changes in demand.
The Mintel research found that three quarters of consumers say that easier-to-understand nutritional information on product packaging would encourage them to cut down on unhealthy food/drink. We’d love to see improved labelling too, to see what the impact could be.
Takeaway message
It’s going to take months and years to assess the impact the tax has on the nation’s health. And, of course, obesity is caused by many factors. Clearly multiple strategies including education will be needed to combat the problem. We’ll be monitoring closely to see whether the action has any impact on those most affected by obesity – those in the lower socio-economic bracket and children.
Do you agree it’s a step in the right direction? Should the Government be focussing on something else to better address the problem?
by Tanya HAFFNER | Mar 26, 2018 | Hot Topics in nutrition
This week, the Daily Mail and the Express reported on the benefits of nuts and seeds, stating that snacking on them could halve the risk of premature death.
This comes following a study published in the American Journal of Clinical Nutrition into omega-6 fatty acid linoleic acid, for which nuts and seeds are a good source.
Study background and findings
The study was carried out following debate about the health effects of linoleic acid.
On the one hand, there was the view that it can reduce cholesterol levels and can increase the production of anti-inflammatory compounds, therefore helping reduce disease.
On the other hand, there was speculation that it may actually cause inflammation when it gets converted in the body into arachindonic acid, thereby increasing the risk of several chronic diseases.
The research aimed to clarify matters…
- 2,480 men aged between 42 and 62 years were followed for 22 years.
- Blood levels of the linoleic acid were taken during the study. These levels are determined by your diet.
- By the end of the study, 1,143 deaths due to disease had occurred.
- When grouped according to blood linoleic acid levels, the risk of premature death was 43% lower in the group with the highest linoleic acid levels, compared to the group with the lowest level. There was also a lower risk of death due to cardiovascular diseases, as well as for death due to reasons other than cardiovascular diseases or cancer.
- No specific association between omega-6 levels and death due to cancer was found.
- The researchers support the current dietary recommendations to increase linoleic acid intake for cardiovascular disease prevention.
Behind the headlines: the Nutrilicious dietetic view
Was it a valuable study?
The study had a few weaknesses:
- Only a single baseline fatty acid measurement was taken for all men. Dietary habits can change during such a long follow up period and this could alter the results.
- Higher levels of blood linoleic acid were associated with a more healthy lifestyle and diet. This could influence the results, meaning we cannot be absolutely sure it is just the levels of linoleic acid causing the effects.
- Only white middle-aged and older men were included in the study. We don’t know whether the findings would be the same for women and other races/ethnicities.
However, it also has considerable strengths:
- Large sample size
- No participants dropped out
- The researchers used an objective biomarker – blood levels of linoleic acid – rather than using dietary recall or assessment measures, which are not very reliable.
Translating the findings into practical guidance
To help prevent cardiovascular disease, current guidelines are that we should be limiting our intakes of saturated fats to 20g per day for women and 30g per day for men.
They should be replaced with unsaturated fats including monounsaturated and polyunsaturated fats, which provide essential fatty acids and fat-soluble vitamins.
Linoleic acid is the most common type of polyunsaturated omega-6 fatty acid, so we’d recommend unsalted nuts as a daily snack. Indeed, HEART UK state: “Nuts are packed full of heart-healthy nutrients such as protein, soluble fibres, plant sterols, vitamin E, magnesium, potassium, zinc and copper. Because they are also naturally rich in unsaturated fats and low in saturated fat they can help lower cholesterol as part of a diet low in saturated fats.”
A portion of nuts would be considered around 30-35g, which is about one handful (about 175-200 calories).
Nuts are quite high in calories, so those watching their weight may need to consider how and where this fits into a calorie controlled eating plan.
Remember the full picture
While the headlines focus on nuts and seeds, vegetable oils and plant-based spreads are also good sources of linoleic acid.
The shift from saturated to unsaturated fats should form part of an overall healthy diet, such as DASH (Dietary Approaches to Stop Hypertension) or the Mediterranean diet.
More detailed advice into dietary fats can be found from:
by Tanya HAFFNER | Mar 18, 2018 | Hot Topics in nutrition, Media in context, The Nation’s Health
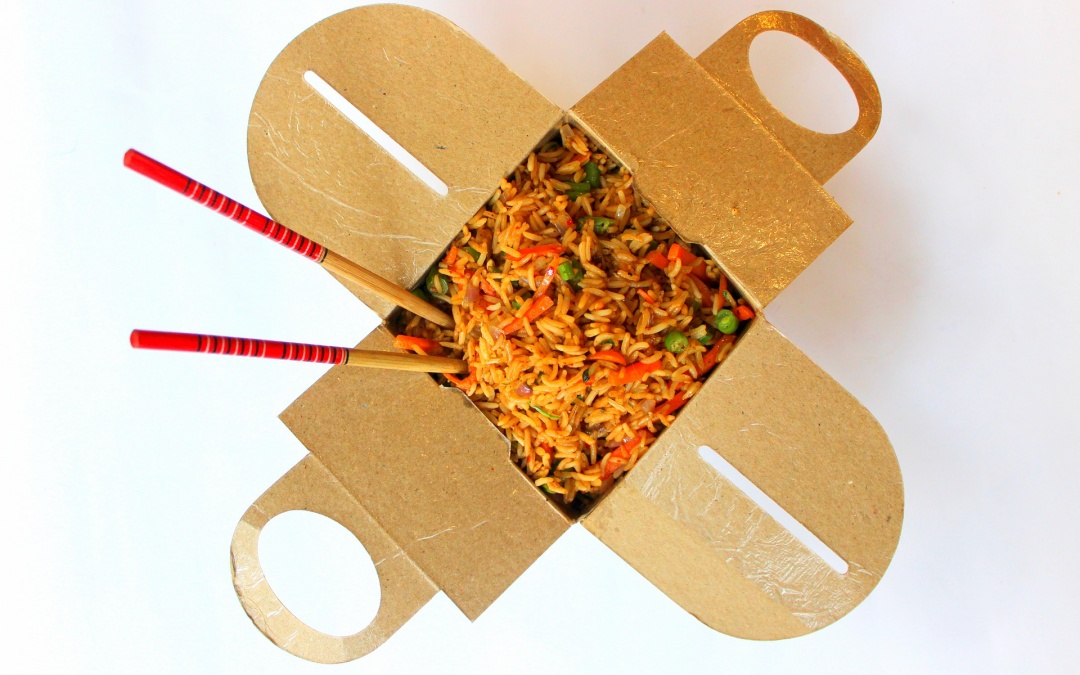
Coinciding with Salt Awareness Week, this week the BBC, the Daily Mail, the Independent and many more reported on how high salt content in Chinese takeaway meals from restaurants and supermarkets.
The news follows analysis published by Action on Salt, who are calling for health warnings to be mandatory.
Keep this in mind as you read on: The maximum daily allowance for adults is 6g per day (about one teaspoon).
Here are some of the key points from the study…
Chinese takeaway meals
Six independent restaurants in London’s Chinatown were analysed
- 97% of dishes contained 2g (1/3 of a teaspoon) or more of salt per dish.
- 58% contained more than 3g (1/2 teaspoon) of salt per dish.
- Combining side dishes on top would provide over 6g (over 1 teaspoon – the maximum daily allowance for adults) salt per day.
- The saltiest takeaway main meal with a rice/noodle side dish contained 11.50g of salt (about 2 teaspoons) (Beef in Black Bean Sauce and Vegetable Noodles).
- Variation was seen between the same dishes but from different restaurants. For example, sweet and sour dishes ranged from 1g to 3.4g of salt per portion.
- On average, beef in black bean sauce dishes were the highest in salt (1.27g per 100g) and sweet and sour dishes were the least salty (0.54g per 100g).
Supermarket ready meals
141 ready meals were surveyed
- Nearly half (43%) were high in salt (containing over 1.5g per 100g or over 1.8g salt per portion). These meals would be coded as ‘red’ under salt on the food traffic light labelling system.
- The highest in salt was Slimming World’s Chinese Style Banquet Rice with 4.40g salt (about 2/3 teaspoon salt) per 550g pack.
- As well as main dishes found to be high in salt, side dishes such as rice dishes, spring rolls and prawn crackers could easily tot up the salt levels. One example of Egg Fried Rice (Iceland’s Takeaway Egg Fried Rice) contained 4.1g (2/3 teaspoon) salt per 350g pack. That’s more salt than is in 11 ready salted bags of crisps!
- Variation was apparent, with Tesco’s Egg Fried Rice containing only 0.1g salt per 250g.
For more detailed findings, see the original analysis PDF
Behind the headlines: the Nutrilicious dietetic view
Points to consider
As ever, we need to note any limitations of the report. While the analysis included a large number of supermarket ready meals, the restaurant analysis was only conducted on six restaurants in London Chinatown, so we cannot be confident findings will be the same elsewhere. Plus, it’s clear that salt levels will vary between restaurants and between meals.
That said, UK adults eat around 22 million takeaways each week, with Chinese being the most popular. Judging by these findings, it seems there is an urgent need to drastically cut salt levels in these meals.
Why is too much salt bad for us?
Too much salt can contribute to raised blood pressure, which increases the risk of stroke and heart disease.
In the UK, we are currently eating more salt than is recommended, averaging 8.1g per day (1.3 teaspoons of salt, about a third more than the maximum recommendation). This is largely due to the high amounts of salt hidden in the food we buy, for which this analysis of Chinese meals provides further support.
The good news is this average intake has actually reduced by 15% over the last decade, primarily due to product reformulation. Now we need to go further.
Is the government taking enough action reduce salt?
- Public Health England have been encouraging the food industry to cut salt levels in food. However, so far there has been little action, with no progress report on whether the last set of salt targets (due to have been met by the end of 2017) have been reached, nor any plans to set new targets.
- As part of this 19th Salt Awareness Week, Action on Salt are calling on Public Health England for immediate action – they want to focus on setting new salt targets, making front of pack labelling mandatory and would like to see warning labels on menus for dishes high in salt. More action is needed from the food industry and the out of home sector to reduce the amount of salt added, and to provide us with healthier choices lower in salt.
- This week, Action on Salt are hosting a Parliamentary Reception at the House of Commons to discuss the future of salt reduction in the UK, with attendees from the Department of Health, Non-Governmental Organisations (NGOs) and the food industry.
Sonia Pombo, Campaign Manager for Action on Salt stated: “Our data shows that food can be easily reformulated with lower levels of salt, so why haven’t all companies acted responsibly? The lack of front-of-pack colour coded labelling on branded products makes it incredibly difficult for consumers to make healthier choices and that is simply unacceptable.”
What can we do to keep our salt intakes low?
Food industry, including all food service providers
All responsible food providers should by now be carrying out at least a six-monthly nutrition and health check on their products and/or recipes, which includes the traffic light coding in order to highlight which ones need to be placed into a programme for reformulation.
At Nutrilicious, we have enjoyed helping numerous food service providers and manufacturers with this ongoing check along with nutrition and advice for ongoing product reformulation and development. If your company or organisation products or recipes need a nutrition and health check we would be delighted to help.
Taking personal responsibility
We should all be keeping salt to a minimum in our diets. For tips and advice on how to do this see:
Clearly, reducing intake of pre-packaged foods and takeaways is important for reducing salt intake, as shown in this analysis.
In the case for ready-made foods, being aware of what the labels mean can help with making wiser choices. For salt, a product is considered high in salt if it contains more than 1.8g salt per portion or if it is over 1.5g salt per 100g of the product.
Takeaway messages
This analysis highlights that salt levels can be extremely high in Chinese takeaway meals and supermarket ready meals. The relevance of reducing salt intake is paramount; each 1g reduction in daily salt intake prevents 7,000 deaths, 4,000 of which are premature, from strokes and heart disease.
We are pleased to see Action on Salt calling on Public Health England to take more action in this issue. Key messages for healthy eating apply to us all: eat a balanced diet, with plenty of fruit and vegetables, wholegrains and less processed foods and takeaways. This can help lower not only salt, but also sugar, fats and saturated fats; all of which in too high amounts can have negative health effects.
Following this advice – alongside other healthy lifestyle decisions such as keeping physically active – can help keep us in good health and reduce the chances of developing negative health effects such as obesity, heart disease and cancer.