by Tanya HAFFNER | Jun 18, 2018 | Thoughts
The latest National Diet and Nutrition Survey (NDNS) highlighted that 91% of women of childbearing age (16 to 49 years) in the UK have folate levels that are too low.
It’s in the early stages of pregnancy that the foetus rapidly develops spine and nerve cells. Low folate levels increase the risk of foetal Neural Tube Defects (NTDs), such as spina bifida, so folic acid is recommended as a supplement.
Yet a recent survey of 750 pregnant women carried out by baby charity Tommy’s showed that:
- One in five women started taking folic acid before contraception
- One in six women did not take folic acid at all
Previous large studies have seen similar low levels of folic acid intake. For example, a study of nearly half a million women in England and the Isle of Man found less than 1 in 3 women had taken folic acid supplements before pregnancy.
What is the current advice for folic acid supplements?
Women planning a pregnancy (ideally two to three months before conception) are advised to take a 400-microgram supplement of folic acid until the 12th week of pregnancy.
Women with diabetes and those who have had a pregnancy previously affected by NTDs may need a 500-microgram supplement. For more information on who may need higher doses, see the National Health Service.
The advice for taking a supplement is in addition to eating foods rich in folate, the natural form of folic acid. Top sources of folate include green leafy vegetables, citrus fruits, beans and legumes, yeast extract and fortified foods. Eating these foods alone will not meet the demands of a pregnant women and their developing baby.
For more information, the British Dietetic Association (BDA) have produced a factsheet on folic acid.
Folic acid fortification: the UK needs to get up to speed
Over 80 countries have introduced mandatory fortification of flour with folic acid, to help reduce the number of babies affected with NTDs.
The UK hasn’t yet followed suit. In 2002, the Food Standards Agency (FSA) advised against mandatory fortification because folic acid supplements were believed to mask the anaemia caused by B12 deficiency (which causes ongoing nerve damage) and lead to an increased risk of colon cancer in certain groups.
However, more recent research has found no significant links between high doses of folic acid and cancer. In addition, countries that already have mandatory folic acid flour fortification in place haven’t seen an increase in people developing nerve damage as a result of B12 deficiency.
Highlighting the benefits, the US has seen a 23% fall in pregnancies with NTDs since the policy was introduced in 1998. A 2016 study published in the British Medical Journal estimated that 2,000 pregnancies associated with NTDs would have been prevented if the UK had adopted the same fortification as the US from 1998.
The most recent update from the Scientific Advisory Committee on Nutrition, which considers all the evidence for and against folic acid supplementation, echoed previous advice they had given supporting mandatory fortification of flour with folic acid in the UK. The FSA also now support mandatory fortification. Unfortunately, the UK government has remained unwilling to introduce regulation.
The BDA have information on how their members can help support the introduction of folic acid fortification to put pressure on the UK government.
What’s next for folic acid intake?
Folic acid plays a crucial role for the prevention of NTDs in babies but many women are not taking the recommended supplement before pregnancy.
In response to their findings, Tommy’s have created a new online tool, Planning for Pregnancy, which helps women plan for healthy pregnancies. It was created alongside the Royal College of Obstetricians and Gynaecologists, Public Health England and the UCL Institute for Women’s Health. The tool provides advice on folic acid and other factors involved for a healthy pregnancy and will hopefully prove to be a useful resource for women planning to become pregnant. Dietitians, nutritionists and all involved in food and health communications have a role in promoting such resources.
At a policy level, we hope to see the UK government enforce mandatory fortification of flour in the UK as a simple way to increase folic acid for everyone, in light of the wealth of evidence to support the measure.
Of course, in addition to taking folic acid pre-conception, there are other points to be aware of to help ensure a healthy pregnancy including avoidance of smoking, avoiding alcohol, being a healthy weight before pregnancy (BMI between 18.5kg/m2 and 24.9kg/m2) and engaging in regular moderate exercise.
by Tanya HAFFNER | Jun 4, 2018 | The Nation’s Health
One in two people in the UK will be affected by cancer at some point in their lives. The important new expert report by the World Cancer Research Fund (WCRF) has been published, evaluating the links between diet, nutrition, physical activity and cancer and the past decade of cancer prevention research.
It finds that around 40% of cancers could be prevented by making healthy lifestyle choices.
Here’s a summary of the key findings, along with WCRF recommendations about how we can best help prevent cancer.
Key lifestyle factors linked to cancer
1. Body fatness
- There is strong evidence that greater body fatness is a cause of many cancers – including pancreatic cancer, liver cancer and ovarian cancer. Science in relation to the link has grown over the last decade.Rates of overweight and obesity have been rising in most countries. Figures released on obesity just this week show that in the UK almost 60% more children in their last year of primary school are classified as ‘severely obese’ than in their first year.WCRF says that if current trends continue, being overweight or obese is likely to overtake smoking as the number one risk factor for cancer.
- Whilst greater weight gain in adulthood increases the risk of post-menopausal breast cancer, evidence showed that being overweight or obese as an adult before menopause decreases the risk of pre-menopausal breast cancer. Also, being overweight or obese between the ages of 18 and 30 years decreased the risk of pre- and postmenopausal breast cancer.Despite the findings, it is important to know that WCRF recommend maintaining a healthy weight throughout all stages of life.
WCRF Expert Panel opinion – Keep weight within the healthy BMI range (18.5kg/m2 – 24.9kg/m2) and avoid weight gain in adult life. WCRF explain more about BMI and provide a useful BMI calculator.
2. Dietary factors
a. Wholegrains, vegetables and fruit
- Wholegrains and other foods containing dietary fibre decrease the risk of colorectal cancer. This includes both foods that naturally contain fibre and foods that have had fibre added.
- Beta-carotene in foods or supplements is unlikely to have a substantial effect on the risk of prostate cancer.
- Foods contaminated by aflatoxins (toxins found in some fungi) increase the risk of liver cancer. Find out more about what this means on the WCRF website.
- Foods preserved by salting increase the risk of stomach cancer.
WCRF Expert Panel opinion – For wholegrains and other foods containing dietary fibre, the evidence shows that, in general, the more people consume, the lower the risk of some cancers.
We are advised to consume at least 30 grams of fibre per day (see the fibre fact sheet from the British Dietetic Association for more information on how to achieve this).
A diet high in all types of plant foods is recommended including at least five portions of vegetables and fruit per day. This poster from WCRF shows what counts as a portion.
b. Animal products
- Red meat and processed meat increase the risk of colorectal cancer.
- Cantonese-style salted fish increases the risk of nasopharyngeal cancer.
- Dairy products decrease the risk of colorectal cancer.
WCRF Expert Panel opinion – For people who eat meat, limit consumption of red meat, such as beef, pork and lamb, to no more than three portions per week: 350–500g cooked weight. Eat little, if any, processed meat.
c. Alcoholic drinks
- Consuming alcoholic drinks increases the risk of:
- Mouth, pharynx and larynx cancers
- Oesophageal cancers
- Breast cancer (pre- and post-menopause)
- Two or more alcoholic drinks a day increase the risk of colorectal cancer.
- Three or more alcoholic drinks a day increase the risk of stomach cancer and liver cancer.
- Up to two alcoholic drinks a day decrease the risk of kidney cancer (though note, WCRF advise that this is far outweighed by the increased risk for other cancers).
WCRF Expert Panel Opinion – The evidence shows that, in general, the more alcoholic drinks people consume, the higher the risk of many cancers.
WCRF advise that for cancer prevention, it’s best not to drink any alcohol at all. Indeed, there is no threshold for the level of consumption below which there is no increase in the risk of at least some cancers.
3. Physical activity
- Being physically active decreases the risk of:
- Colon cancer
- Breast cancer (post-menopause)
- Endometrial cancer
- Vigorous physical activity (e.g. running or fast cycling) decreases the risk of:
- Pre- and post-menopausal breast cancer
WCRF Expert Panel Opinion – The evidence implies that, in general, the more physically active people are, the lower the risk of some cancers.
We are advised to do at least 150 minutes of moderate intensity activity (examples include brisk walking, cycling, household chores, swimming, dancing) or 75 minutes of vigorous activity (examples include running, aerobics, squash, netball, fast cycling) per week.
4. Other factors related to cancer
The report also covers links between cancer and other dietary factors (including glycaemic load, vitamin supplements and non-alcoholic drinks); height and birth weight; and lactation. For more information, see the summary report.
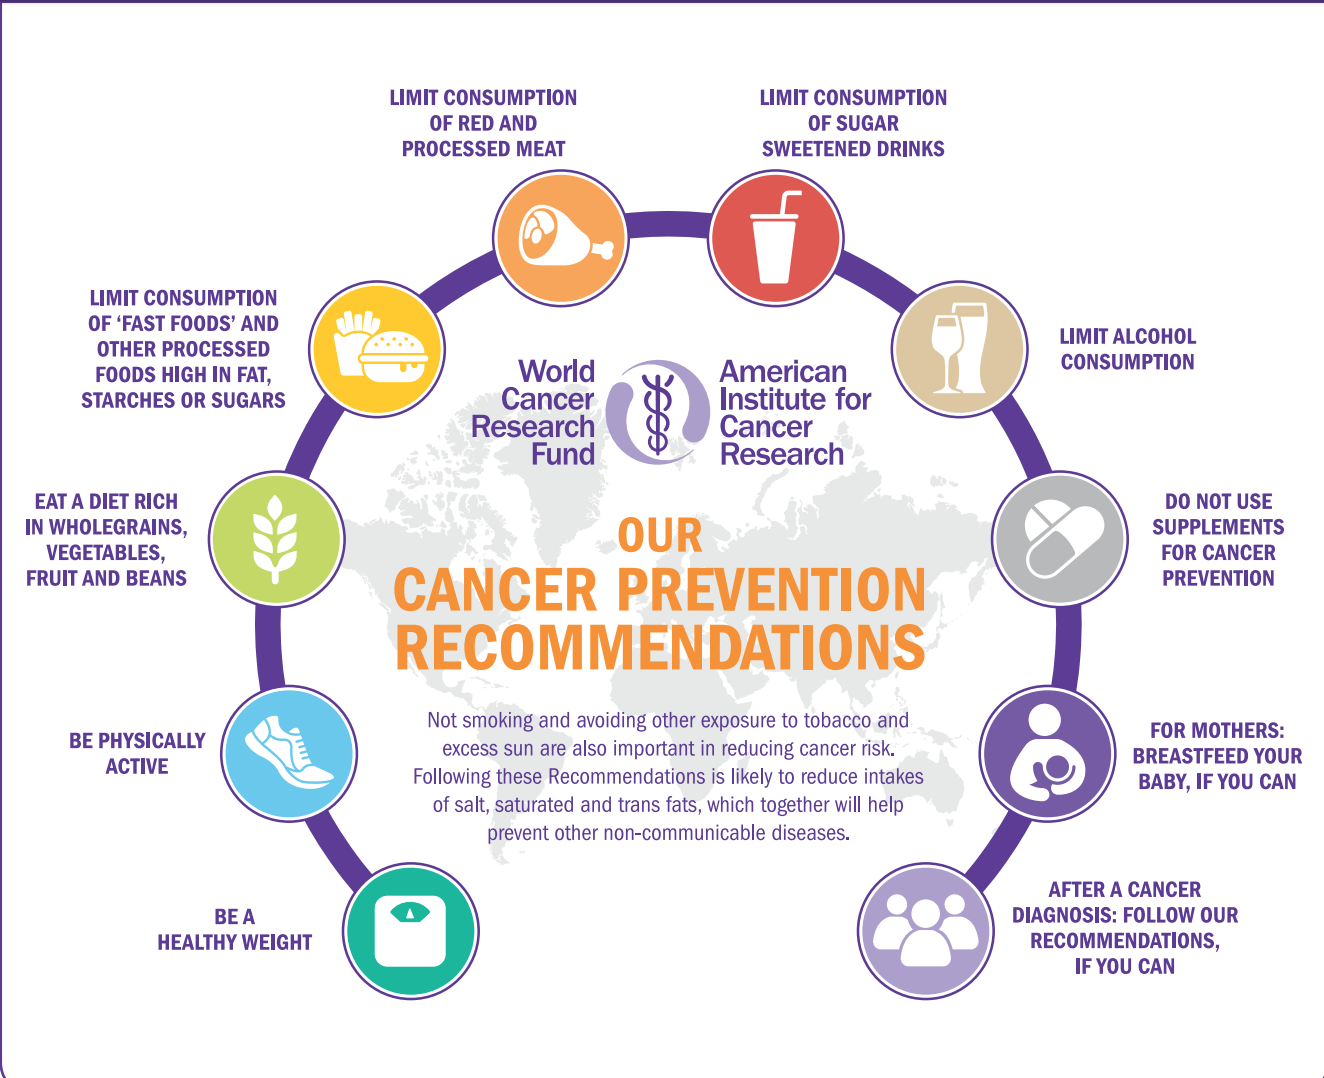
The 10 cancer prevention recommendations
The report includes 10 key recommendations for cancer prevention. Shown here as an overview infographic, there’s lots more useful detail in the report itself.

For lifestyle factors as discussed within this report, incorporating the recommendations into our lives as a whole package, rather than just focusing on a few individually, will be the most conducive for cancer prevention. It is interesting to know that between 30-50% of all cancer cases are estimated to be preventable through healthy lifestyles and avoiding exposures to occupational carcinogens (substances capable of causing cancer), environmental pollution and certain long-term infections.
NEW resources to help with cancer prevention:
- Cancer Health Check – A new online questionnaire check has been launched to help individuals find out where they are doing well and where they could make changes to their lifestyle to help reduce the risk of cancer.
- Toolkit – WCRF have published a downloadable toolkit which shows key points from the report using lots of visual representations of the findings.
- Interactive Cancer Risk Matrix – This tool gives information on how different aspects of diet, as well as body weight and physical activity, might be linked to cancer risk based on the strength of the evidence.
- Individual sections of the report – these can be accessed digitally as PDFs or as toolkits. This allows us to zoom in on specific dietary factors or different cancers and find out the evidence from the main report.
by Tanya HAFFNER | May 25, 2018 | Hot Topics in nutrition, The Nation’s Health
This week, Public Health England (PHE) published their first assessment on the government’s sugar reduction programme, introduced to help reduce rates of childhood obesity.
The food industry – including retailers, manufacturers, restaurants, cafes and pub chains – was given the target to cut 20% of sugar from a range of products by 2020, with a 5% reduction in the first year. The first year of the programme was from August 2016 to August 2017.
What does the assessment show?
- Retailers and manufacturers have achieved only a 2% reduction in sugar.
- Sugar has been reduced by 11% by retailers and manufacturers in drinks that are included in the Soft Drinks Industry Levy and average calories per portion has been reduced by 6%.
- New guidelines have been published for the drinks industry to reduce sugar in juice and milk-based drinks.
Importantly, PHE highlight that there are forthcoming sugar reduction plans from the food industry and that some changes of products were not captured in the data (as the changes took effect after the one-year mark measured). This all points towards hopefully seeing greater reductions in future assessments.
Measuring the progress
Ten food categories were measured that contribute the most sugar to children’s diets, although breakfast pastries and cakes were not included due to insufficient data. Some of the key findings from the assessment include:
- Reductions in sugar levels were seen across five of the categories.
- Yogurts and fromage frais, breakfast cereals, and sweet spreads and sauces have all met or exceeded the initial 5% sugar reduction ambition.
- Biscuits and chocolate confectionary have seen no change at all in sugar levels.
- The puddings category has actually seen a slight (1%) increase in sugar content overall.
- It has been noted that for the eating out of home sector, portion sizes in products likely to be consumed in one go are substantially larger (on average more than double) those of retailers and manufacturers.
- Calories in products likely to be consumed in one go have reduced in four categories. Of these, ice cream, lollies and sorbets, and yogurts and fromage frais have reduced average calories by more than 5%. Often this is due to smaller portion size.
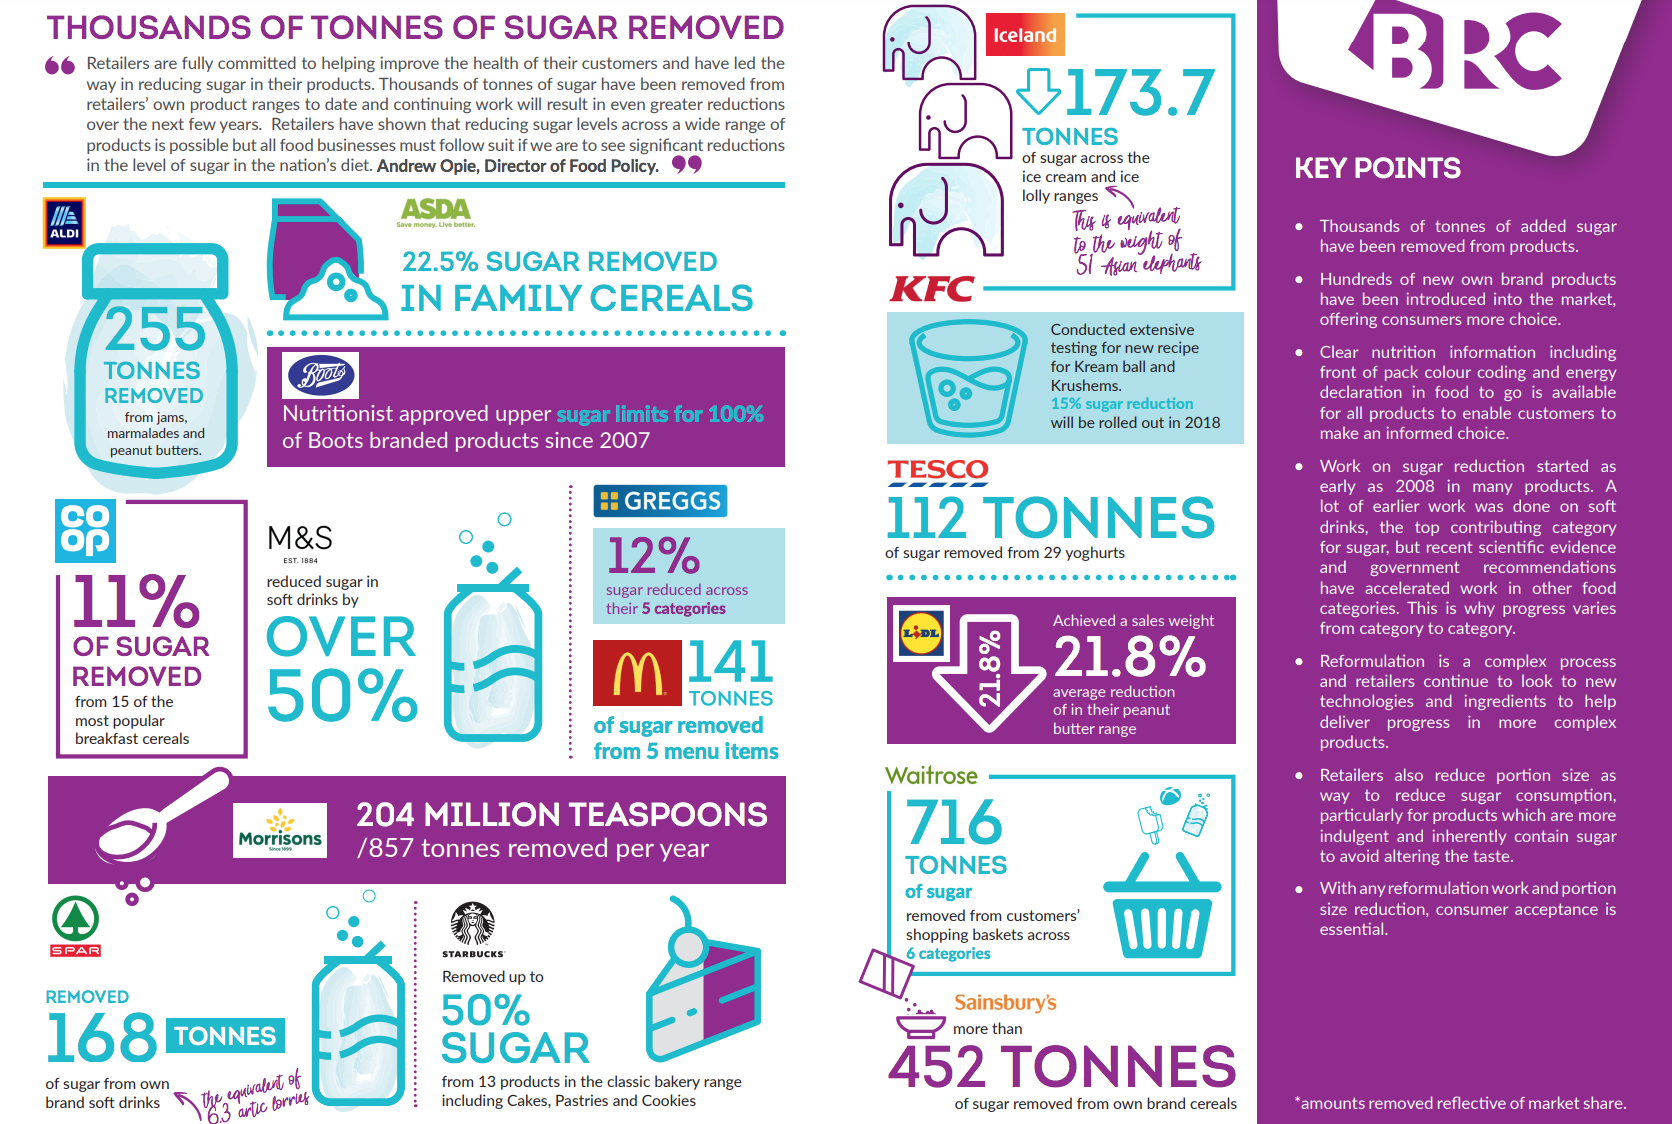
The British Retail Consortium (BRC) provided an interesting infographic showing how the food industry has been cutting sugar.

In response to the PHE assessment, Andrew Opie, Director of Food Policy at the BRC, stated: “Retailers are fully committed to helping improve the health of their customers and have led the way in reducing sugar in their products. Thousands of tonnes of sugar have been removed from retailers’ own product ranges to date and continuing work will result in even greater reductions over the next few years.
“Retailers have shown that reducing sugar levels across a wide range of products is possible but all food businesses must follow suit if we are to see significant reductions in the level of sugar in the nation’s diet.”
The British Dietetic Association‘s Head of External Affairs, Jo Instone, said: “We recognise that there are limitations in the data and that these are the early stages of the reformulation programme. However, it is disappointing to have such significant gaps and for a number of manufacturers to have refused to allow information on their progress to be published.”
“Clearly, it will be important for the BDA, the Obesity Health Alliance and others to continue working with Public Health England and the government to drive this programme forward. We would hope that the 2019 report can fill in a number of gaps and that we will see more substantial progress made across the board.”
Milk based drinks and juice
Following our concern about sugar levels in fruit juice, we’re pleased to see new plans by PHE encouraging the drinks industry to achieve the following by mid-2021:
- Reduce sugar in juice-based drinks by 5% (excluding single juice – that is, products with juice from a single fruit with nothing added to it).
- Cap all juice-based drinks (including blended juices, smoothies and single juices) likely to be consumed in one go to 150 calories.
- Reduce sugar in milk (and milk substitutes) based drinks by 20% and cap products likely to be consumed in one go to 300 calories.
What’s next?
Some progress has been made, but it seems we’re still well off hitting targets for sugar reduction. It’s clear that more work is needed – by manufacturers and retailers, but also cafes and restaurants, where calorie intake tends to be significantly higher.
The next progress report from PHE is due in Spring 2019 and should give a clearer picture on the programme’s progress.
Of course, this is only one of the many strategies needed to help combat the obesity crisis. Along with the BDA and many others, we’re looking forward to hearing government measures for issues including broadcast advertising, in-store promotions and other interventions to help tackle the problem.
by Tanya HAFFNER | May 14, 2018 | Thoughts
In recent years, there has been much debate about whether the government are providing the correct advice for saturated fats in the diet. We have seen many claims that saturated fats may in fact be good for us, with recent headlines causing confusion including:
“Is butter back and is sat fat good?”
“‘Saturated fat good for you’, expert claims”
“Saturated fat link with heart disease questioned”
So we are very pleased to have the much-anticipated Scientific Advisory Committee on Nutrition (SACN) draft review into saturated fat published this week.
SACN’s draft recommendations are:
- The population average contribution of saturated fat to total calorie intake should be no more than 10%. This means no more than 30g of saturated fat for men, no more than 20g for women and less for children.
- Dietary saturated fats should be substituted with unsaturated fats. Foods like fish (especially oily fish such as mackerel, salmon and trout), unsalted nuts, seeds and avocado are sources of unsaturated fat.
The rationale behind this is the wealth of evidence linking saturated fats to an increased risk of high blood cholesterol, which can increase the risk of cardiovascular disease (CVD).
SACN advise that reducing saturated fats can help improve blood lipids and also blood glucose control. There is also no evidence that reducing intake of saturated fat increases risk of any of the outcomes considered: cardiovascular disease, blood lipids, blood pressure, diabetes, dementia and some cancers.
This new review from SACN helps support advice that we should not be promoting regular use of coconut oil (another trend of recent years: see our coconut oil blog). Indeed, coconut oil is made up of around 85% saturated fats, with 1 tablespoon providing a hefty 12g of saturated fat.
How does this compare to previous guidance?
The previous review was undertaken by SACN’s predecessor Committee on Medical Aspects of Food Policy in 1994 and concluded that saturated fat intake should be no more than 10% of total calories for adults and children aged five and older.
SACN have come to the conclusion that the new evidence supports and strengths the above original recommendation and hence there are no changes to the current government advice.
How much saturated fat do we eat in the UK?
In the UK, average saturated fat intakes are at around 12% of calories. There are improvements to be made to meet the 10% target.
Most of our intake comes from milk products (such as whole milk and cheese), cereal products and meat products.
What are the best saturated fat substitutes?
The review considers what we substitute saturated fat with and the effects on our health. It concludes that the best is to replace saturated fats with monounsaturated fats and polyunsaturated fats.
This fully supports recent consensus on saturated fat reductions from the World Health Organisation 2016 meta-analysis focusing on impact on serum lipids, and the 2015 Cochrane review by Hooper focusing on cardiovascular disease outcomes. Both come to more or less the same conclusions. (If you’re interested in the basic chemistry of fats, do read the WHO analysis, it’s particularly interesting!)
When discussing substitution of saturated with carbohydrates, they highlighted that there is ‘adequate’ evidence that when saturated fats are replaced with carbohydrates alone, this is linked with an increased risk of heart disease.
However, SACN states there was a lack of good quality evidence that differentiated between types of carbohydrates and their resulting effects on heart disease. Different carbohydrates can have different effects on the body (for example, due to varying fibre content). Further research that differentiates between the types of carbohydrates is clearly needed.
Takeaway message
In a nutshell, the draft guidelines support current advice that we need to reduce saturated fat intake and replace it with unsaturated fats.
For more information on how to lower your saturated fats intake, see Heart UK’s website.
by Tanya HAFFNER | May 13, 2018 | Thoughts
The ‘clean eating’ and protein trends have spawned a new type of snack – energy and protein balls. Foodie blogs and Instagram are packed with pictures and accompanying recipes. There’s also a wide range being sold in health food stores and supermarkets.
They are billed as a healthy energy boost, targeted especially at gym-goers, young adults and busy mums (try searching for #energyball, it will almost always also be tagged #healthy).
But behind the obvious hype, do they offer any real nutritional health benefits?
At Nutrilicious we under undertook a full nutrition and health analysis to answer this question. Our team of dietitians assessed seven brands currently on sale in the UK – a total of 44 balls.
A summary of our assessment
Protein and energy balls trade on a healthy image that isn’t always deserved.
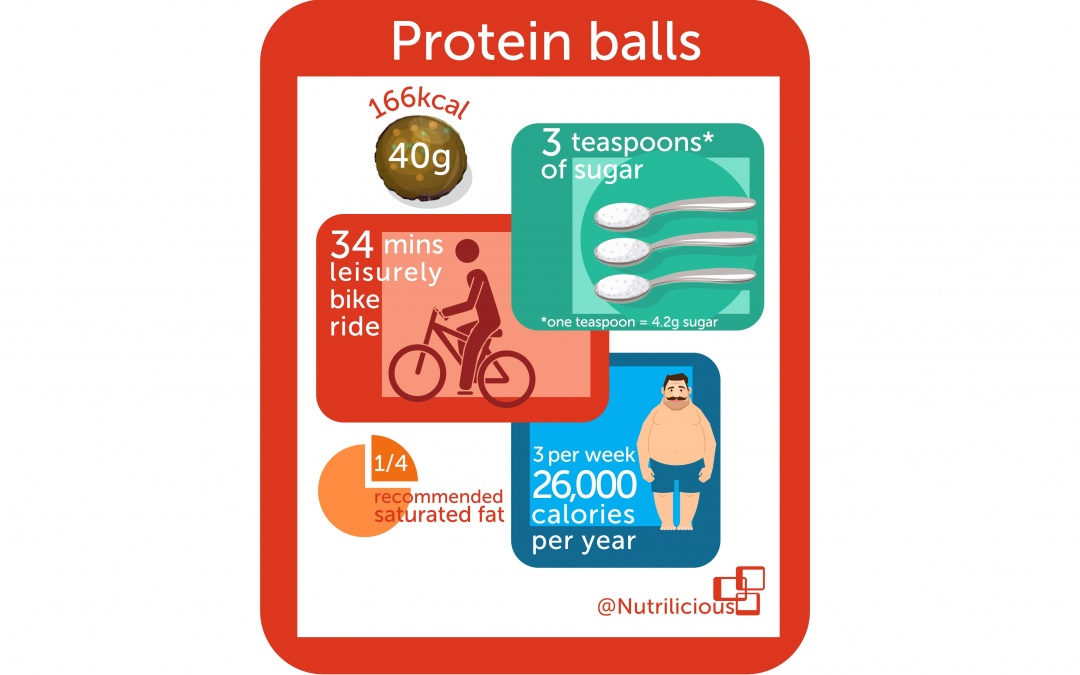
- One protein ball, three times a week = 26,000kcal a year, at an average cost of £312.
- None of the balls tested were low in sugars, very few were low in saturated fat – especially the balls with added coconut.
- Replacing part of the calories we burn off at the gym with a protein/energy ball negates the benefits of physical activity.
- More protein is not necessarily better. We generally don’t need more protein in our diet, rather we need to spread our intake through the day.
- Consumers would be better off tucking into alternative, cheaper snacks that provide a lower saturated fat, lower sugar, tasty protein/energy boost, such as a reduced fat hummus with red pepper crudités or a small prawn or chicken salad sandwich.
The analysis in depth
- Protein
Are the balls ‘protein rich’?
By law, to be permitted to claim ‘a source of’ protein a product must provide at least 12 per cent of energy from this nutrient. To be a ‘rich’ source means that the product must provide at least 20% of energy as protein.
Of the 22 protein balls analysed, the majority are indeed ‘rich’ in protein, providing 20-28% energy as protein. Only five are just ‘a source of’ protein. The protein in these products comes often from whey protein, but also (especially in vegan friendly options) from the likes of hemp, pea protein, almonds, and so on, providing a source of plant protein.
However, despite being able to claim they are rich in protein, per serving they provide on average just 8.5g. The protein quantity varies significantly between brands, with some providing as little as 2.6g while others provide as much as 13g per serve.
Do we actually need more protein?
Even if the balls are providing a high level of protein, it’s not necessarily a good thing. Protein intakes in the UK are already above recommendations of 1g per kg body weight and excess protein consumed will simply be converted to fat in the body.
It’s not about more protein, but rather optimising our protein intakes. Rather than having more, we need to spread our protein intake better through the day, so our bodies can process it.
- Calories
All the balls we analysed are energy dense – in other words, they pack in a lot of calories.
The average 40g protein ball provides 166kcals; the average 33g energy ball provides 129kcals. These are similar in calories to:
- A 330ml can of lemon or cola based drink (around 138kcal)
- 2 chocolate digestives (142kcal)
- ¾ standard Mars Bar (165kcal)
Some marketers use the term ‘energy boost’ to sell their product, knowing consumers do not tend to associate this with extra unnecessary calories that will more than likely turn to body fat. With 60% of the population overweight or obese, and an average national BMI of 27, the reality is that the majority people don’t need this added ‘energy boost’ – they already consume too many calories.
This is even true of the target audience of those who do regular exercise. Adding further calories from an energy ball would just counter all the hard work done at the gym. In order to burn off the calories from just one 40g protein ball (which can be consumed in a single bite), it would require the average UK female (BMI of 27, weighing around 70.3kg) to undertake one of the following:
- 35 mins brisk walking (where you’re slightly out of breath)
- 34 mins leisurely bike ride
- 21 mins moderate to high impact aerobics
- 19 mins on a rowing machine – moderate intensity
- 14 mins breast stroke
- 10 mins running fast up the stairs
- Sugars
None of the products in our analysis scored green (<=5%) for sugars.
In fact, it’s not uncommon to find a sugars content that’s more than 40% – higher than sugary cereals. The highest we found was in an energy ball with 54.9%, providing 26.4g sugars per ball serve.
In many cases, the sugars are added. For the majority of the balls on the market, much of the sugar is the ‘free’ type, with date, agave and malt syrups being popular choices of added sugar. These sweeteners are often erroneously thought to be a healthier choice than ‘refined’ sugar and manufacturers can (and do) capitalise on this misconception, allowing their high sugar products to seem more wholesome than they are.
In a few products, sugars come only from dried fruit – which seems like a good thing. However, breaking down of the structure of the dried fruit during processing will result in the normally ‘intact’ sugars becoming ‘free’ and affect the body and teeth no differently to table sugar. If the aim is to increase fruit and vegetable intake, the best option is for fresh, frozen or canned.
Energy balls on average provide 11.3g sugars; protein balls provide 12.7g sugars per serve. This is 38% to 42% of the recommended daily free sugars intakes for adults and teens.
- Saturated fats
In all but a handful of cases, the energy/protein balls score either amber or red in the traffic light system for cholesterol-raising saturated fat.
Only 6/44 (14%) products analysed scored green (<=1.5%) for saturated fats.
An average portion provides 1.7g saturated fat – 8.5 % of the Recommended Intake (RI). Highest levels tend to be found in protein balls that contain a lot of desiccated coconut – the highest we found (in a product weighing 45g) was 4.95g saturates, or 25% of the RI.
- Price
With most protein/energy balls costing nearly £2 per serving, they are an expensive snack.
What should change?
Our calorie and protein consumption: and where it comes from
a. Manufacturers are trading on the expectation from many consumers – frequently young women – that energy/protein balls are more wholesome, more ‘energising’ and more satiating than other snacks.
But we already get enough energy (calories) and protein in our diet. And if we do need more, we could be sourcing them from foods that are a lot cheaper and that can provide a more rounded nutrient profile. These healthier and cheaper equivalent protein sources are an example:
- 1¼ medium eggs – 44% fewer calories, no added sugars: 18p
- 35g chicken (about 1/5 of a chicken breast) – 76% fewer calories, less saturated fat, no added sugars: 28p
- 170g serving of low fat yogurt – 34% fewer calories, no added sugars, lower in saturated fats: 33p
- 200g individual can of baked beans – same calories, no saturated fat, lower in added sugars: 18p
b. To help optimise the body’s natural muscle protein synthesis, we should actually be reducing our overall protein intake and spreading the load more evenly throughout the day. We need to add more protein to breakfast and cut back on the protein at lunch and dinnertime.
- Marketing the products
Responsible marketing is needed to ensure consumers who can afford this luxury use energy or protein balls as a replacement and not an addition to their current intakes. It is well known that the term ‘energy’ does not translate to calories for consumers, and the ongoing misuse of this term can only contribute to the ongoing overconsumption of energy dense foods in the UK.
Manufacturers should target consumers who are most likely to benefit from these products: elite athletes; those with poor appetites or higher than average requirements; and amateur sports individuals during periods of strenuous exercising/training. But even the International Society for Sports Nutrition emphasises every day foods first and foremost rather than ‘super bars’.