by Tanya HAFFNER | Aug 1, 2018 | Hot Topics in nutrition, The Nation’s Health, Surveys and insights
An extensive detailed analysis of the current scientific evidence into omega-3 seems to have thrown a spanner in the works for heart health dietary advice.
Conducted by Cochrane, the review concludes that there is no correlation between cardiovascular health and intakes of the long chain omega-3 fats eicosapentaenoic acid (EPA) and docosahexaenoic acid (DHA) over a one- to six-year period.
Long chain omega-3 fats have long been associated with reductions in blood triglycerides, blood pressure and thrombosis; producing anti-inflammatory and anti-arrhythmia effects as well as improving endothelial function and insulin sensitivity.
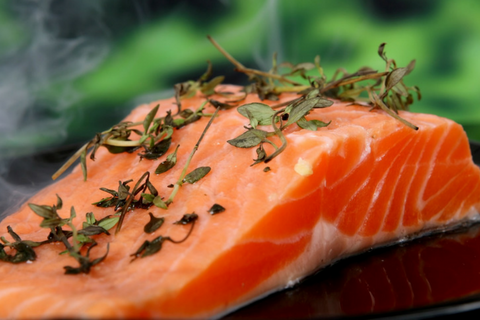
This most recent publication will raise many eyebrows within the heart health professional arena and likely to be taken up by media editors who seem to enjoy questioning the trustworthiness of public health guidelines. These recommend a diet including omega-3, especially found in oil-rich fish such as salmon, tuna and mackerel.
So, do we need to change dietary guidelines on the importance of omega-3 and oil-rich fish?
Before we jump the gun, it’s important to put things into context:
1. The shortcomings of the review
a. The studies investigated in this review predominantly used omega-3 supplements. Thus the outcomes cannot be related to oil-rich fish consumption which is the main dietary source of EPA and DHA.
b. The studies were also of one to six years’ duration, which is a relatively short period to assess disease and mortality risk. And conclusions cannot be reached for a lifetime consumption of foods rich in EPA or DHA.
c. Many of the studies may not have used adequate number pf subjects in the studies to elicit a result. This is especially the case for studies conducted in healthy individuals (and therefore low risk of heart disease), which would require very high numbers to demonstrate a difference in the omega-3 and non-omega-3 study groups.
d. Any studies conducted over the last two decades of people at risk of cardiovascular disease (CVD) will be in individuals already medicated with statins and other cardio-protective drugs, which may mask the effect, if any, of additional omega-3.
2. Omega-3 benefits go beyond heart health
Long chain omega-3 fats are critical for eye and brain development of the foetus and young children. Therefore, food sources should be included in a healthy balanced diet of children and adults planning for a family.
3. Oil-rich fish is not just omega-3. It offers so many health benefits.
a. Unlike omega-3 supplements, oil-rich fish is a rich source of not only the long chain omega-3 fats but also of selenium, zinc, vitamin D and iodine; woefully lacking in the UK diet.
b. Oil-rich fish has a healthier fat profile when compared to red meat and other animal proteins. Replacing saturated fat with unsaturated fat in the diet has been proven to have a positive effect on blood lipids and cardiovascular health (as confirmed by Cochrane’s 2015 review and the SACN’s & the WHO’s draft 2018 reports). See our saturated fat blog
Indeed, the authors themselves remind us of the other nutritional benefits of oil-rich fish and that this review does not negate public health advice that consuming oil-rich fish is beneficial to health.
The Nutrilicious view
Taking vitamin and mineral supplements as a substitute for eating a healthy balanced diet has never been encouraged by health professionals. However, dietitians recognise that when demands for specific nutrients are high, or when an individual’s nutritional intake is at proven risk of being compromised, supplements can play an important role. For example, pregnancy and folic acid; under-5 year olds and vitamins C and D; or sufferers of osteoporosis and calcium and vitamin D.
Therefore, these findings do not come as any surprise: omega-3 supplements are not a solution to better heart health. There are numerous dietary and lifestyle factors that impact on heart health. It should always be about food rather than the benefits of single nutrients.
As Linda Main, Dietitian and dietary advisor for cholesterol charity HEART UK, explains: “We continue to advise the lifelong consumption of a heart healthy diet centred around eating whole foods rather than the emphasis being on nutrients.
“Eating patterns such as the Mediterranean, DASH or the UCLP© diets result in the consumption of a nutritionally appropriate diet. This is characterised by eating plenty of vegetables, fruits, wholegrains, vegetable proteins such as nuts and soya, seeds, vegetable oils and spreads. In those who consume animal proteins, the inclusion of low fat dairy, lean and largely unprocessed meat and white and oily fish and seafood are recommended.
“Omega-3 supplements are not currently advised by HEART UK and would not be our first choice, except when prescribed by a recognised qualified health professional or when needed to safeguard the intake of the essentially fatty acid – alpha-linolenic acid.”
As oil-rich fish is an excellent low saturated fat protein source, and the main dietary source of long-chain omega-3 fats as well as other crucial nutrients, it should continue to be part of dietary guidelines.
Additionally, for those wishing to follow a more plant-based diet, it’s reassuring that the report finds consumption of the shorter chain omega-3 fats found in plant foods (like rapeseed and soya oil) has cardio-protective qualities. This supports findings from population studies that vegetarians and vegans have a lower incidence of cardiovascular events and mortality compared to non-vegetarians.
Current UK heart health dietary advice remains unchanged:
- Lower the amount of food eaten which is high in saturated fat and replace it with foods high in unsaturated fats (which Cochrane’s 2015 review supports, SACN 2017 Saturated fat draft guidance).
- Increase our intake of fibre (especially from beans, pulses, oats and barley), nuts.
- Consume at least five servings of fruit and vegetables daily.
- Reduce intakes of red meat and avoid/limit processed meat.
- Consume two portions of fish weekly – one of which should be oil rich.
- Increase intakes of leaner and plant-sources of protein.
- Use sterol or stanol fortified products (if blood cholesterol is raised after other dietary changes have been made).
It’s interesting to note that, unlike the US, the UK does not (and has never) recommended taking dietary supplements of omega-3 fish oil.
For up to date expert advice on heart health visit: heartuk.org.uk
Further references
Saturated fat and heart health reports
Supplements for specific groups
NHS UK: Vitamins for children; Vitamins, supplements and nutrition in pregnancy
Vegetarian and vegan diets and health outcomes
- Rizzo N, Jaceldo-Siegl K, Sabate J et al. Nutrient profiles of vegetarian and non-vegetarian dietary patterns. J Acad Nutr Diet.. 2013;113(12):1610-9.
- Sobiecki J, Appleby P, Bradbury K et al. High compliance with dietary recommendations in a cohort of meat eaters, fish eaters, vegetarians, and vegans: results from the European Prospective Investigation into Cancer and Nutrition-Oxford study. Nutr Res.. 2016;36(5):464-77.
- Springmann M, Godfray H, Rayner M et al. Analysis and valuation of the health and climate change cobenefits of dietary change. Proc Natl Acad Sci U S A.. 2016;113(15):4146-51.
- Clarys P, Deliens T, Huybrechts I et al. Comparison of nutritional quality of the vegan, vegetarian, semi-vegetarian, pesco-vegetarian and omnivorous diet. Nutrients.. 2014;6(3):1318-32.
Cochrane is an established body of researchers, health professionals and patients across the globe renowned for their high quality scientific reviews of nutrition and health evidence.
by Tanya HAFFNER | Jun 4, 2018 | The Nation’s Health
One in two people in the UK will be affected by cancer at some point in their lives. The important new expert report by the World Cancer Research Fund (WCRF) has been published, evaluating the links between diet, nutrition, physical activity and cancer and the past decade of cancer prevention research.
It finds that around 40% of cancers could be prevented by making healthy lifestyle choices.
Here’s a summary of the key findings, along with WCRF recommendations about how we can best help prevent cancer.
Key lifestyle factors linked to cancer
1. Body fatness
- There is strong evidence that greater body fatness is a cause of many cancers – including pancreatic cancer, liver cancer and ovarian cancer. Science in relation to the link has grown over the last decade.Rates of overweight and obesity have been rising in most countries. Figures released on obesity just this week show that in the UK almost 60% more children in their last year of primary school are classified as ‘severely obese’ than in their first year.WCRF says that if current trends continue, being overweight or obese is likely to overtake smoking as the number one risk factor for cancer.
- Whilst greater weight gain in adulthood increases the risk of post-menopausal breast cancer, evidence showed that being overweight or obese as an adult before menopause decreases the risk of pre-menopausal breast cancer. Also, being overweight or obese between the ages of 18 and 30 years decreased the risk of pre- and postmenopausal breast cancer.Despite the findings, it is important to know that WCRF recommend maintaining a healthy weight throughout all stages of life.
WCRF Expert Panel opinion – Keep weight within the healthy BMI range (18.5kg/m2 – 24.9kg/m2) and avoid weight gain in adult life. WCRF explain more about BMI and provide a useful BMI calculator.
2. Dietary factors
a. Wholegrains, vegetables and fruit
- Wholegrains and other foods containing dietary fibre decrease the risk of colorectal cancer. This includes both foods that naturally contain fibre and foods that have had fibre added.
- Beta-carotene in foods or supplements is unlikely to have a substantial effect on the risk of prostate cancer.
- Foods contaminated by aflatoxins (toxins found in some fungi) increase the risk of liver cancer. Find out more about what this means on the WCRF website.
- Foods preserved by salting increase the risk of stomach cancer.
WCRF Expert Panel opinion – For wholegrains and other foods containing dietary fibre, the evidence shows that, in general, the more people consume, the lower the risk of some cancers.
We are advised to consume at least 30 grams of fibre per day (see the fibre fact sheet from the British Dietetic Association for more information on how to achieve this).
A diet high in all types of plant foods is recommended including at least five portions of vegetables and fruit per day. This poster from WCRF shows what counts as a portion.
b. Animal products
- Red meat and processed meat increase the risk of colorectal cancer.
- Cantonese-style salted fish increases the risk of nasopharyngeal cancer.
- Dairy products decrease the risk of colorectal cancer.
WCRF Expert Panel opinion – For people who eat meat, limit consumption of red meat, such as beef, pork and lamb, to no more than three portions per week: 350–500g cooked weight. Eat little, if any, processed meat.
c. Alcoholic drinks
- Consuming alcoholic drinks increases the risk of:
- Mouth, pharynx and larynx cancers
- Oesophageal cancers
- Breast cancer (pre- and post-menopause)
- Two or more alcoholic drinks a day increase the risk of colorectal cancer.
- Three or more alcoholic drinks a day increase the risk of stomach cancer and liver cancer.
- Up to two alcoholic drinks a day decrease the risk of kidney cancer (though note, WCRF advise that this is far outweighed by the increased risk for other cancers).
WCRF Expert Panel Opinion – The evidence shows that, in general, the more alcoholic drinks people consume, the higher the risk of many cancers.
WCRF advise that for cancer prevention, it’s best not to drink any alcohol at all. Indeed, there is no threshold for the level of consumption below which there is no increase in the risk of at least some cancers.
3. Physical activity
- Being physically active decreases the risk of:
- Colon cancer
- Breast cancer (post-menopause)
- Endometrial cancer
- Vigorous physical activity (e.g. running or fast cycling) decreases the risk of:
- Pre- and post-menopausal breast cancer
WCRF Expert Panel Opinion – The evidence implies that, in general, the more physically active people are, the lower the risk of some cancers.
We are advised to do at least 150 minutes of moderate intensity activity (examples include brisk walking, cycling, household chores, swimming, dancing) or 75 minutes of vigorous activity (examples include running, aerobics, squash, netball, fast cycling) per week.
4. Other factors related to cancer
The report also covers links between cancer and other dietary factors (including glycaemic load, vitamin supplements and non-alcoholic drinks); height and birth weight; and lactation. For more information, see the summary report.
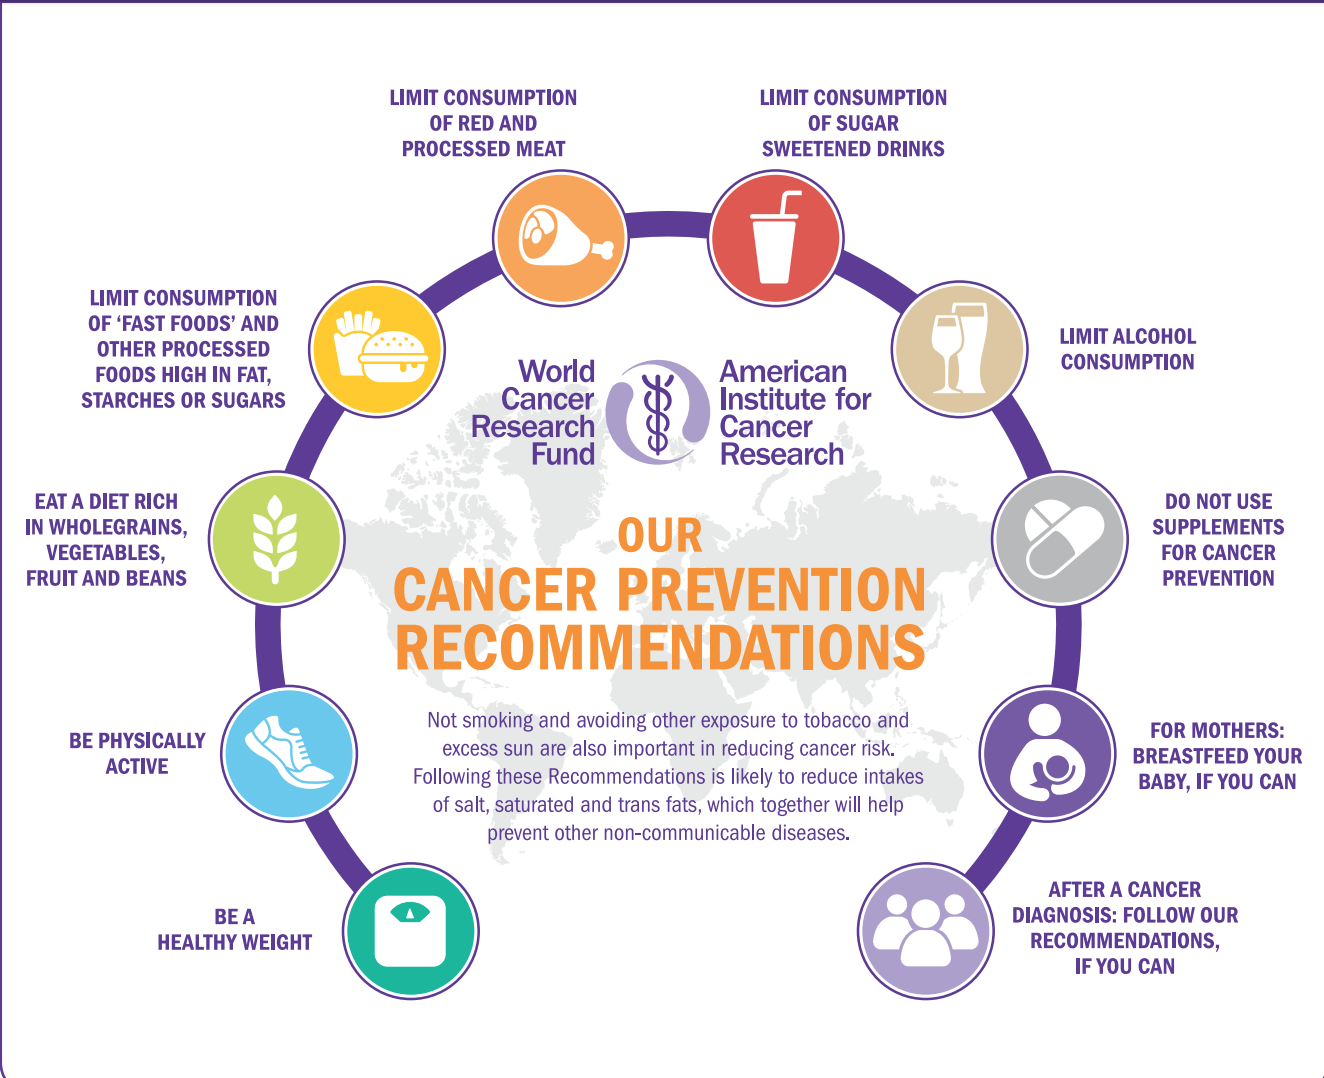
The 10 cancer prevention recommendations
The report includes 10 key recommendations for cancer prevention. Shown here as an overview infographic, there’s lots more useful detail in the report itself.

For lifestyle factors as discussed within this report, incorporating the recommendations into our lives as a whole package, rather than just focusing on a few individually, will be the most conducive for cancer prevention. It is interesting to know that between 30-50% of all cancer cases are estimated to be preventable through healthy lifestyles and avoiding exposures to occupational carcinogens (substances capable of causing cancer), environmental pollution and certain long-term infections.
NEW resources to help with cancer prevention:
- Cancer Health Check – A new online questionnaire check has been launched to help individuals find out where they are doing well and where they could make changes to their lifestyle to help reduce the risk of cancer.
- Toolkit – WCRF have published a downloadable toolkit which shows key points from the report using lots of visual representations of the findings.
- Interactive Cancer Risk Matrix – This tool gives information on how different aspects of diet, as well as body weight and physical activity, might be linked to cancer risk based on the strength of the evidence.
- Individual sections of the report – these can be accessed digitally as PDFs or as toolkits. This allows us to zoom in on specific dietary factors or different cancers and find out the evidence from the main report.
by Tanya HAFFNER | May 25, 2018 | Hot Topics in nutrition, The Nation’s Health
This week, Public Health England (PHE) published their first assessment on the government’s sugar reduction programme, introduced to help reduce rates of childhood obesity.
The food industry – including retailers, manufacturers, restaurants, cafes and pub chains – was given the target to cut 20% of sugar from a range of products by 2020, with a 5% reduction in the first year. The first year of the programme was from August 2016 to August 2017.
What does the assessment show?
- Retailers and manufacturers have achieved only a 2% reduction in sugar.
- Sugar has been reduced by 11% by retailers and manufacturers in drinks that are included in the Soft Drinks Industry Levy and average calories per portion has been reduced by 6%.
- New guidelines have been published for the drinks industry to reduce sugar in juice and milk-based drinks.
Importantly, PHE highlight that there are forthcoming sugar reduction plans from the food industry and that some changes of products were not captured in the data (as the changes took effect after the one-year mark measured). This all points towards hopefully seeing greater reductions in future assessments.
Measuring the progress
Ten food categories were measured that contribute the most sugar to children’s diets, although breakfast pastries and cakes were not included due to insufficient data. Some of the key findings from the assessment include:
- Reductions in sugar levels were seen across five of the categories.
- Yogurts and fromage frais, breakfast cereals, and sweet spreads and sauces have all met or exceeded the initial 5% sugar reduction ambition.
- Biscuits and chocolate confectionary have seen no change at all in sugar levels.
- The puddings category has actually seen a slight (1%) increase in sugar content overall.
- It has been noted that for the eating out of home sector, portion sizes in products likely to be consumed in one go are substantially larger (on average more than double) those of retailers and manufacturers.
- Calories in products likely to be consumed in one go have reduced in four categories. Of these, ice cream, lollies and sorbets, and yogurts and fromage frais have reduced average calories by more than 5%. Often this is due to smaller portion size.
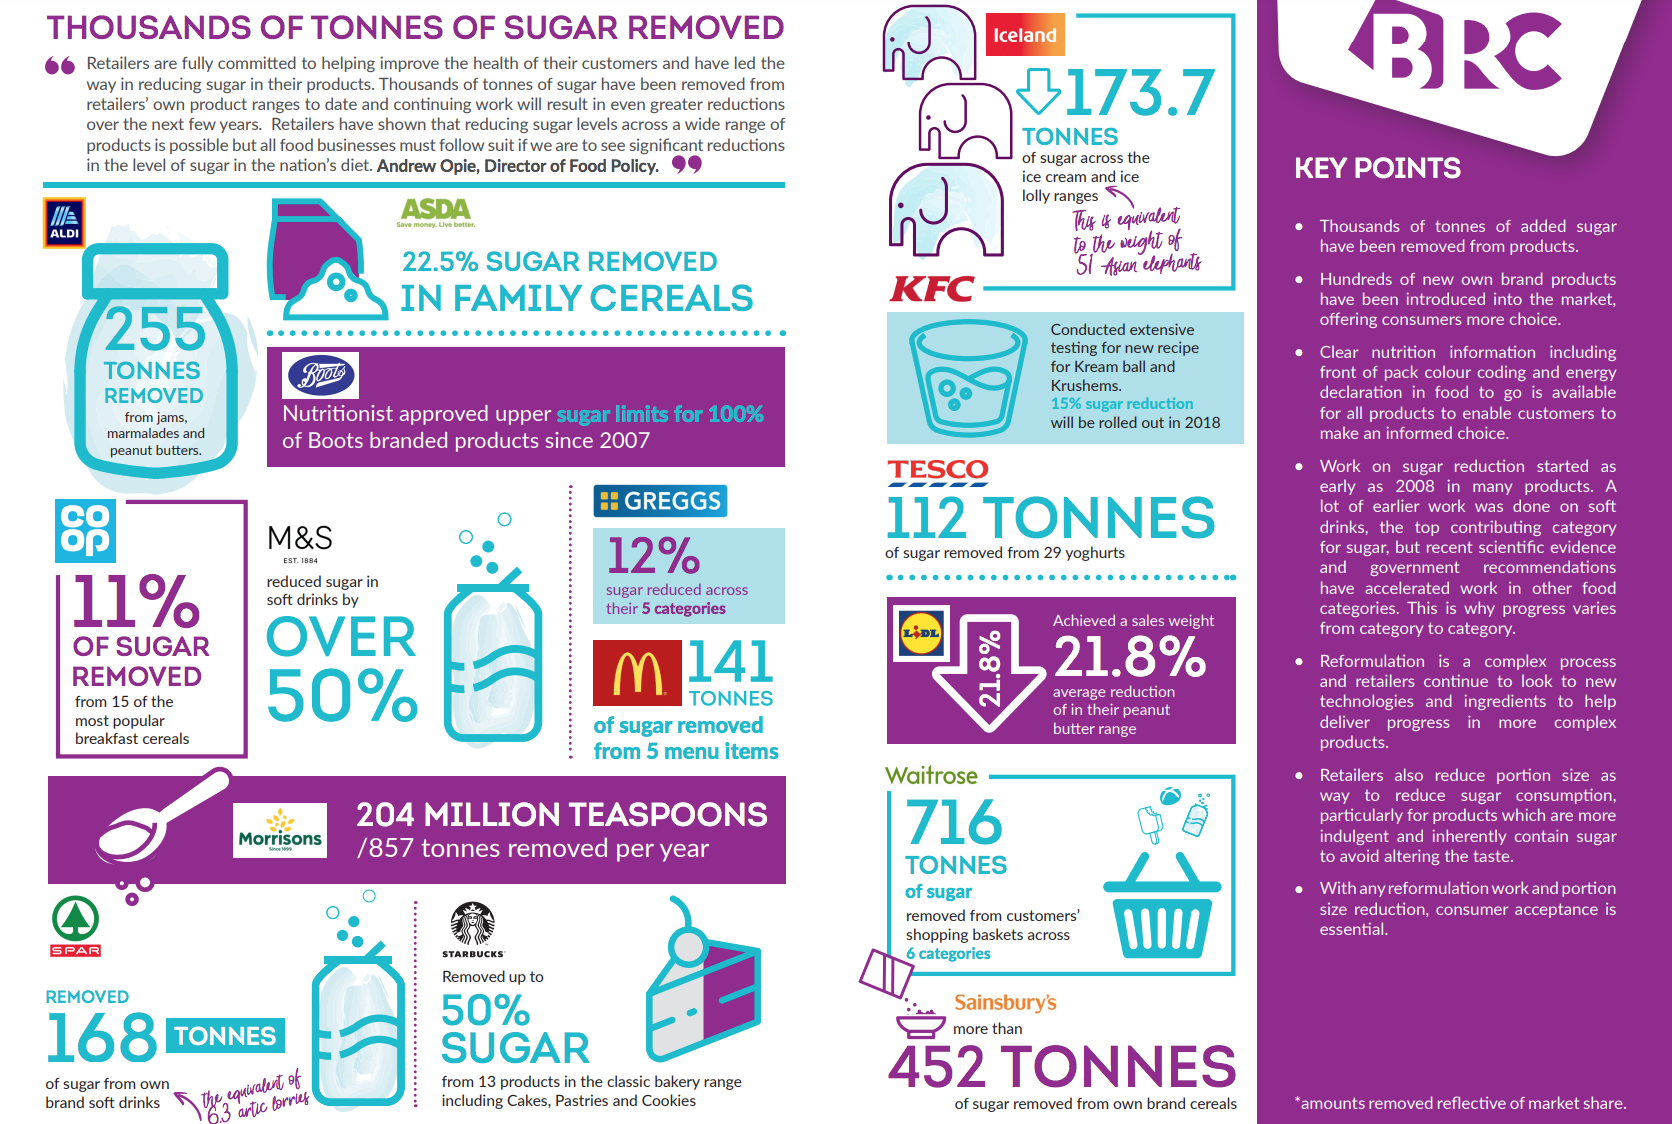
The British Retail Consortium (BRC) provided an interesting infographic showing how the food industry has been cutting sugar.

In response to the PHE assessment, Andrew Opie, Director of Food Policy at the BRC, stated: “Retailers are fully committed to helping improve the health of their customers and have led the way in reducing sugar in their products. Thousands of tonnes of sugar have been removed from retailers’ own product ranges to date and continuing work will result in even greater reductions over the next few years.
“Retailers have shown that reducing sugar levels across a wide range of products is possible but all food businesses must follow suit if we are to see significant reductions in the level of sugar in the nation’s diet.”
The British Dietetic Association‘s Head of External Affairs, Jo Instone, said: “We recognise that there are limitations in the data and that these are the early stages of the reformulation programme. However, it is disappointing to have such significant gaps and for a number of manufacturers to have refused to allow information on their progress to be published.”
“Clearly, it will be important for the BDA, the Obesity Health Alliance and others to continue working with Public Health England and the government to drive this programme forward. We would hope that the 2019 report can fill in a number of gaps and that we will see more substantial progress made across the board.”
Milk based drinks and juice
Following our concern about sugar levels in fruit juice, we’re pleased to see new plans by PHE encouraging the drinks industry to achieve the following by mid-2021:
- Reduce sugar in juice-based drinks by 5% (excluding single juice – that is, products with juice from a single fruit with nothing added to it).
- Cap all juice-based drinks (including blended juices, smoothies and single juices) likely to be consumed in one go to 150 calories.
- Reduce sugar in milk (and milk substitutes) based drinks by 20% and cap products likely to be consumed in one go to 300 calories.
What’s next?
Some progress has been made, but it seems we’re still well off hitting targets for sugar reduction. It’s clear that more work is needed – by manufacturers and retailers, but also cafes and restaurants, where calorie intake tends to be significantly higher.
The next progress report from PHE is due in Spring 2019 and should give a clearer picture on the programme’s progress.
Of course, this is only one of the many strategies needed to help combat the obesity crisis. Along with the BDA and many others, we’re looking forward to hearing government measures for issues including broadcast advertising, in-store promotions and other interventions to help tackle the problem.
by Tanya HAFFNER | Apr 27, 2018 | The Nation’s Health
The new sugar tax on soft drinks excludes fruit juices, as they are legally labelled as having ‘no added sugar’. With child obesity levels ever-increasing, especially among lower socio-economic groups, this worries us.
It also highlights the increasingly frequent and often damaging disconnect between legislation, nutrition science and public health guidance.
Fruit juice is a liquid form of ‘free sugars’, with little of the fibre naturally found in fruit. Additionally, some of the essential vitamins present in fruit juice such as B vitamins, folate and vitamin C are added to fruit juice at the end of processing. So the perception of it as a ‘naturally healthy’ drink is misleading.
Here’s why and when we’re concerned about fruit juice…
Confusing labelling: no added sugar, one of your five a day
‘Added’ vs ‘free’ sugars
With fruit juice packaging labelled with ‘no added sugars’ and the government’s ‘counts as one of your five a day,’ it’s not surprising that consumers perceive fruit juice as better for you than sweetened soft drinks.
EU law permits 100% fruit juice that does not contain any other forms of ‘added sugars’ to be labelled as having ‘no added sugars’.
That sounds logical, right? Except it clashes with the World Health Organisation (WHO) and Public Health England (PHE), who both classify fruit juice as a source of ‘free’ sugars. This is because structure of the fruit has been broken down to release sugars in their free form, which behave in the same way in the body as other forms of more commonly understood ‘free’ sugars, for example table sugar. Like fruit juice, table sugar is simply a result of extracting/freeing naturally occurring sugars from the structure of the beet or cane plant.
The most recent PHE publication in March this year makes things crystal clear, ‘[Free sugars are] all monosaccharides and disaccharides added to foods by the manufacturer, cook or consumer, plus sugars naturally present in honey, syrups and unsweetened fruit juices’.
Vitamins, minerals and fibre in fruit juice
Despite this clear scientific reasoning on sugar, PHE continues to permit 150ml daily allowance of fruit juice to count as one of your five a day.
This is based on the fact that the UK continues to under-consume whole fruit and vegetables, which are critical to meet our essential vitamin C and potassium requirements.
150ml orange juice is equivalent to a medium orange for vitamins, minerals and total sugars. It will provide vitamin C in excess of our requirements and 7-30% of our potassium needs (depending on age), plus vitamin B1 (thiamine). However:
- Fibre: fruit juice 0.1 – 0.9g per 150ml (even one with ‘bits’) vs a medium orange at 1.9g.
- Free sugars: fruit juice 12.3g vs none in a medium orange.
The truth about fruit juice sugars
In terms of free sugars, weight for weight there’s little difference between fruit juice and soft drinks.
|
Amount of free sugars |
% daily free sugars max. recommendations |
| 2-3 yr olds (14g) |
4-6 yr olds
(19g) |
7-10 yr old
(24g) |
11 yr olds and older
(30g) |
| 1 medium (160g) orange |
0 |
0% |
0% |
0% |
0% |
| 150ml pure orange juice |
12.3g |
88% |
65% |
51% |
41% |
| 150ml cola drink |
16.4g |
117% |
86% |
68% |
55% |
| 150ml lemonade |
8.7g |
62% |
46% |
36% |
29% |
Studies looking at fruit juice intakes and impact on health proved challenging for SACN when reviewing their recommendations. Evidence for fruit juice and impact on health was found to be lacking, inconsistent and / or of poor quality.
The problem of portion size
If everyone was to keep to 150ml of a sweetened liquid per day, there would be no issue with fruit juice or sweetened beverages. The problem is, this official advice is given to a nation where it has been found that only 1% of the UK population achieve healthy eating recommendations.This 150ml of sweetened liquid per day will in reality not be followed or achieved by the majority. Not least because it’s difficult to keep to 150ml of fruit juice when, in the main, it is sold in 200ml and 1litre cartons, and most household glasses are around 200-250ml.
Fruit juice is the top contributor to free sugars’ intake for young people
According to the government’s 2018 National Diet and Nutrition Survey, fruit juice remains the number one free sugars contributor for 1½ to 10 year olds. This is highly indicative of mum’s perception that fruit juice, unlike sweetened soft drinks, is ‘natural’, has ‘no added sugars’ and therefore good for their children.
During teen years, sweetened beverages takes prominent first place. Fruit juice drops down to third position but still contributing to almost 10%.
Dental decay
It’s not just weight that’s an issue. The UK has one of the highest incidence of dental caries globally. Dental health is dependent on multiple factors, including the frequency and timing of sugar consumption and length of time teeth and gums are exposed to acidic and sugary foods.
Both fruit juice and sweetened beverages are acidic and contain large amounts of ‘free sugars’. They are therefore not recommended by the British Dental Association (BDA). If fruit juice is to be consumed, the BDA recommends diluting it – 1 part juice to 10 parts water. Despite a common misconception around whole fruit, the BDA highlights that fruit, although acidic, is not a risk to dental health except when consumed in unusually large quantities.
The bottom line is that consumers need to be aware that there is little difference between sweetened beverages and fruit juice when it comes to tooth decay. The recommended drink by all health organisations is either water or milk for optimum health.
What would we like to see?
Free sugars are not essential for human health. Due to our over-consumption, they have become a major contributor to our calorie over-consumption.
However, it would be unrealistic to avoid them altogether, and if consumed in moderation as part of a healthy, balanced diet and lifestyle, there should be no problem at all. The government has set maximum recommended intakes for all ages.
- 0-1 year = no free sugars should be introduced
- 2-3 years = no more than 14g / 3½ tsp per day
- 4-6 years = no more than 19g / 4½ tsp per day
- 7-10 years = no more than 24g / 6 tsp per day
- 11 years plus = no more than 30g / 7 tsp per day
In the context of the current health state of our nation, consumers are struggling with the ‘in moderation’ and ‘balanced diet’ (otherwise obesity and obesity-related diseases would not continue to escalate).We are at crisis point with our unhealthy choices, which are having untold preventable health and economic impacts.
People need clearer advice and support to stop over-consumption and have a healthier understanding and relationship with food and drink.
When it comes to fruit juice, we believe it’s time to start promoting the benefits of consuming real fruit, which provide so much more nutrition, contain no free sugars and very unlikely to be over-consumed.
The law should change to take into consideration international and national classifications of ‘free’ and ‘added’ sugars.
What do you think? Join our discussion on LinkedIn
by Tanya HAFFNER | Apr 16, 2018 | Hot Topics in nutrition, The Nation’s Health
This month, the much anticipated sugar tax came into force in the UK. So what it is, why was it introduced and – most importantly – will it have any impact?
The tax
Soft drinks companies are now required to pay a levy on drinks with certain levels of added sugar:
- 18p per litre of drink if the product contains more than 5g of sugar per 100ml
- 24p per litre if it contains 8g of sugar per 100ml.
The tax does not apply to milk-based drinks, due to their calcium content. It also excludes fruit juice or vegetable juice that don’t have added sugar.
Foods such as cakes, biscuits and other sugar containing foods aren’t covered, but there is a separate initiative to reduce their sugar content by 20% by 2020.
Why was it introduced?
The tax has been introduced in an effort to tackle childhood obesity. The latest National Diet and Nutrition Survey (NDNS) showed that sugar-sweetened drinks are the single highest source of free sugars for children and teenagers. This is why soft drinks have been targeted.
Action already taken by the industry
An estimated 50 per cent of manufacturers have already reduced the sugar content of their drinks to avoid the new tax, including leading brands:
- Fanta – reduced sugar from 6.9g (a little under 2 tsp) to 4.6g (just over 1 tsp) per 100ml.
- Ribena – from 10g (2.5 tsp) to less than 4.5g (just over 1 tsp) per 100ml.
- Lucozade – from 13g (just over 3 tsp) to less than 4.5g (just over 1 tsp) per 100ml.
- Irn Bru – from 10.3g (2.5 tsp) to 4.7g (just over 1 tsp) per 100ml.
Others remain the same, for example Coca-Cola (10.6g per 100ml, just over 2.5 tsp) and Pepsi (11g per 100ml, just under 3 tsp). These manufacturers have to decide whether to bear the cost of the tax increase themselves, or pass it on to consumers.
In one leading supermarket, the cost of a 2L bottle of Pepsi went up by 45p when the tax was introduced. By contrast, Coca Cola kept the price the same but reduced the portion size: a 1.75L bottle has shrunk to 1.5L bottle.
Will it work?
A survey by Mintel of 2,000 people found that just under half (47%) of Brits say that a tax making unhealthy food or drink more expensive would encourage them to cut down on these items. So the measure will hopefully have some effect.
It’s extremely positive that some food manufacturers have already taken action to reduce the sugar content of their recipes. However, the feedback hasn’t always been positive about the new taste of much-loved products (reduced sugar Lucozade and Irn Bru, for example). And a significant proportion of people will simply pay more for the same recipe high-sugar drink they’ve always enjoyed.
We’re also concerned that drinks that fell outside of taxable products, such as fruit juice, often still have high levels of free sugars. The National Health Service discusses maximum intakes of free sugars for all ages.
What happens now?
Drinks manufacturers have made an initial decision on whether to reduce sugar levels to avoid the new taxation or to leave sugar levels unaltered. They’ll be closely monitoring orders from retailers to assess the effectiveness of their initial decision. If it proves that sales of reduced-sugar drinks increases, other manufacturers may be keen to follow suit.
Drinks retailers will need to carefully monitor demand for those reduced-sugar drinks vs unaltered recipes that are subject to the tax, to satisfy any changes in demand.
The Mintel research found that three quarters of consumers say that easier-to-understand nutritional information on product packaging would encourage them to cut down on unhealthy food/drink. We’d love to see improved labelling too, to see what the impact could be.
Takeaway message
It’s going to take months and years to assess the impact the tax has on the nation’s health. And, of course, obesity is caused by many factors. Clearly multiple strategies including education will be needed to combat the problem. We’ll be monitoring closely to see whether the action has any impact on those most affected by obesity – those in the lower socio-economic bracket and children.
Do you agree it’s a step in the right direction? Should the Government be focussing on something else to better address the problem?
by Tanya HAFFNER | Mar 18, 2018 | Hot Topics in nutrition, Media in context, The Nation’s Health
Coinciding with Salt Awareness Week, this week the BBC, the Daily Mail, the Independent and many more reported on how high salt content in Chinese takeaway meals from restaurants and supermarkets.
The news follows analysis published by Action on Salt, who are calling for health warnings to be mandatory.
Keep this in mind as you read on: The maximum daily allowance for adults is 6g per day (about one teaspoon).
Here are some of the key points from the study…
Chinese takeaway meals
Six independent restaurants in London’s Chinatown were analysed
- 97% of dishes contained 2g (1/3 of a teaspoon) or more of salt per dish.
- 58% contained more than 3g (1/2 teaspoon) of salt per dish.
- Combining side dishes on top would provide over 6g (over 1 teaspoon – the maximum daily allowance for adults) salt per day.
- The saltiest takeaway main meal with a rice/noodle side dish contained 11.50g of salt (about 2 teaspoons) (Beef in Black Bean Sauce and Vegetable Noodles).
- Variation was seen between the same dishes but from different restaurants. For example, sweet and sour dishes ranged from 1g to 3.4g of salt per portion.
- On average, beef in black bean sauce dishes were the highest in salt (1.27g per 100g) and sweet and sour dishes were the least salty (0.54g per 100g).
Supermarket ready meals
141 ready meals were surveyed
- Nearly half (43%) were high in salt (containing over 1.5g per 100g or over 1.8g salt per portion). These meals would be coded as ‘red’ under salt on the food traffic light labelling system.
- The highest in salt was Slimming World’s Chinese Style Banquet Rice with 4.40g salt (about 2/3 teaspoon salt) per 550g pack.
- As well as main dishes found to be high in salt, side dishes such as rice dishes, spring rolls and prawn crackers could easily tot up the salt levels. One example of Egg Fried Rice (Iceland’s Takeaway Egg Fried Rice) contained 4.1g (2/3 teaspoon) salt per 350g pack. That’s more salt than is in 11 ready salted bags of crisps!
- Variation was apparent, with Tesco’s Egg Fried Rice containing only 0.1g salt per 250g.
For more detailed findings, see the original analysis PDF
Behind the headlines: the Nutrilicious dietetic view
Points to consider
As ever, we need to note any limitations of the report. While the analysis included a large number of supermarket ready meals, the restaurant analysis was only conducted on six restaurants in London Chinatown, so we cannot be confident findings will be the same elsewhere. Plus, it’s clear that salt levels will vary between restaurants and between meals.
That said, UK adults eat around 22 million takeaways each week, with Chinese being the most popular. Judging by these findings, it seems there is an urgent need to drastically cut salt levels in these meals.
Why is too much salt bad for us?
Too much salt can contribute to raised blood pressure, which increases the risk of stroke and heart disease.
In the UK, we are currently eating more salt than is recommended, averaging 8.1g per day (1.3 teaspoons of salt, about a third more than the maximum recommendation). This is largely due to the high amounts of salt hidden in the food we buy, for which this analysis of Chinese meals provides further support.
The good news is this average intake has actually reduced by 15% over the last decade, primarily due to product reformulation. Now we need to go further.
Is the government taking enough action reduce salt?
- Public Health England have been encouraging the food industry to cut salt levels in food. However, so far there has been little action, with no progress report on whether the last set of salt targets (due to have been met by the end of 2017) have been reached, nor any plans to set new targets.
- As part of this 19th Salt Awareness Week, Action on Salt are calling on Public Health England for immediate action – they want to focus on setting new salt targets, making front of pack labelling mandatory and would like to see warning labels on menus for dishes high in salt. More action is needed from the food industry and the out of home sector to reduce the amount of salt added, and to provide us with healthier choices lower in salt.
- This week, Action on Salt are hosting a Parliamentary Reception at the House of Commons to discuss the future of salt reduction in the UK, with attendees from the Department of Health, Non-Governmental Organisations (NGOs) and the food industry.
Sonia Pombo, Campaign Manager for Action on Salt stated: “Our data shows that food can be easily reformulated with lower levels of salt, so why haven’t all companies acted responsibly? The lack of front-of-pack colour coded labelling on branded products makes it incredibly difficult for consumers to make healthier choices and that is simply unacceptable.”
What can we do to keep our salt intakes low?
Food industry, including all food service providers
All responsible food providers should by now be carrying out at least a six-monthly nutrition and health check on their products and/or recipes, which includes the traffic light coding in order to highlight which ones need to be placed into a programme for reformulation.
At Nutrilicious, we have enjoyed helping numerous food service providers and manufacturers with this ongoing check along with nutrition and advice for ongoing product reformulation and development. If your company or organisation products or recipes need a nutrition and health check we would be delighted to help.
Taking personal responsibility
We should all be keeping salt to a minimum in our diets. For tips and advice on how to do this see:
Clearly, reducing intake of pre-packaged foods and takeaways is important for reducing salt intake, as shown in this analysis.
In the case for ready-made foods, being aware of what the labels mean can help with making wiser choices. For salt, a product is considered high in salt if it contains more than 1.8g salt per portion or if it is over 1.5g salt per 100g of the product.
Takeaway messages
This analysis highlights that salt levels can be extremely high in Chinese takeaway meals and supermarket ready meals. The relevance of reducing salt intake is paramount; each 1g reduction in daily salt intake prevents 7,000 deaths, 4,000 of which are premature, from strokes and heart disease.
We are pleased to see Action on Salt calling on Public Health England to take more action in this issue. Key messages for healthy eating apply to us all: eat a balanced diet, with plenty of fruit and vegetables, wholegrains and less processed foods and takeaways. This can help lower not only salt, but also sugar, fats and saturated fats; all of which in too high amounts can have negative health effects.
Following this advice – alongside other healthy lifestyle decisions such as keeping physically active – can help keep us in good health and reduce the chances of developing negative health effects such as obesity, heart disease and cancer.