by Nutrilicious | Dec 11, 2015 | Media in context, The Nation’s Health
The media loves a good headline, and the World Health Organisation (WHO) and the International Agency for Research on Cancer (IARC) provided the perfect story on October 26th – processed meat causes cancer. So is bacon the new tobacco?
The review of over 800 studies found conclusive evidence that processed meats cause colorectal cancer, placing them into the AICR’s top category for carcinogenic substances alongside tobacco. Strong associations were also found for stomach cancer. Red meat was classified as ‘probably causing’ colorectal cancer with the working group unable to exclude all other confounding factors from the data available.
So, are sausages and bacon as bad for us as smoking? Comparing the lowest with the highest consumers, the evidence concluded that for every 50g of processed meat consumed a day, the relative risk of colorectal cancer increased by 18% and for every 100g of red meat consumed daily, the risk increased by 17%.
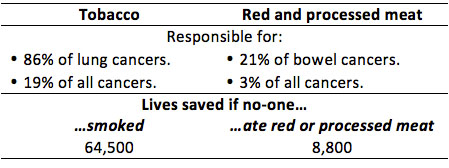
However, when the findings are put into perspective, it is clear that the level of damage caused by smoking is far greater. The IARC, highlights that their findings and risk categories reflect how strong the scientific evidence is for a substance to cause cancer rather than how many incidences of cancer it will actually cause.
Cancer Research UK’s (CRUK) blog on this topic puts things into perspective:
- 61 out of 1,000 people are expected to develop bowel cancer.
- For the lowest meat consumers, this risk will be lower, at around 56 per 1,000.
- For processed meat consumers with a 17% increased relative risk, the incidence would therefore be 66 per 1,000, i.e. 10 more cases per 1,000 for processed vs. non-processed meat consumers.
CRUK went on to put the risk in more real terms.
It’s not about the quality of the meat – it’s all in the cooking or processing technique! The mechanism by which red meat and processed meat cause cancer is still being investigated. However, the current evidence points towards the method of processing and cooking as key drivers for production of carcinogens and there seems little impact with regard to the quality or cut of meat. Processed meats include ancient traditions of smoking, curing and salting as well as any other process to enhance the flavour or shelf life of meat. Included in this category are ham, sausages, bacon, tinned meat and sausages. It is thought that the processing results in the formation of carcinogens within the meat such as N-nitroso-compounds (NOC) and polycyclic aromatic hydrocarbons (PAH).
Get the slow cooker out to help reduce cancer risk! For red meat, which includes pork, beef, lamb and goat, it is the cooking of the meat that seems to generate carcinogenic compounds such as heterocyclic aromatic amines (HAA) and PAH. And these carcinogens like higher temperatures such as those produced during pan frying, grilling and barbecuing.
So how much is too much? On this, there is less clarity as the evidence did not indicate to a ‘safe’ level. CRUK recommends following the current guidelines of no more than 70g red meat per day, avoid processed meat and to use more plant-based protein foods to part or fully replace meat dishes.
How much processed and red meat is the UK currently eating? According to the NDNS data, men eat an average of 86g per day and women 56g. However, there is a significant range from zero for non-meat eaters up to 219g daily for some men. Focusing on the higher processed meat consumers and identifying effective behaviour change strategies seems to be key.
What should our advice be to consumers? Although the Atkin’s supporters may be a little displeased, the average consumer and the press cannot blame scientists and health professionals for always changing their minds. The advice is the same as always…a varied balanced diet, cutting down on red meat and trying to avoid processed meat.
References
- Chan DSM, Lau R, Aune D et al. Red and processed meat and colorectal cancer incidence: meta-analysis of prospective studies. PLoS ONE 6(6): e20456. doi:10.1371/journal.pone.0020456. http://journals.plos.org/plosone/article?id=10.1371/journal.pone.0020456 accessed 5th Nov.
- Bouvard V, Loomis D, Guyton KZ et al. (International Agency for Research on Cancer Monograph Working Group). Carcinogenicity of consumption of red and processed meat. Lancet Oncol. 2015 Oct 23. pii: S1470-2045(15)00444-1. doi: 10.1016/S1470-2045(15)00444-1. [Epub ahead of print] http://www.thelancet.com/journals/lanonc/article/PIIS1470-2045(15)00444-1/abstract Accessed 5th November.
- Dunlop C. Cancer Research UK Science Blog. Processed meat and cancer – what you need to know. 26 October 2015. http://scienceblog.cancerresearchuk.org/2015/10/26/processed-meat-and-cancer-what-you-need-to-know/ Accessed 5th November.
by Nutrilicious | Nov 11, 2015 | Hot Topics in nutrition, The Nation’s Health
Initial thoughts on the recent PHE Report: Sugar Reduction: The evidence for action
Many realists thought it unthinkable, but it happened, the Scientific Advisory Committee on Nutrition (SACN) recommended that sugar recommendations should be halved. Although many have tried to refute it, the evidence is strong for sugar and dental caries and however anyone tries to pull apart the publications associating sugar intake and weight gain, common sense and practical experience tells us, drinking litres of liquid sugar without any other nutritional benefit is not going to help with our struggle against obesity.
Nevertheless, halving sugar recommendations to no more than 5% of energy intake although aspirational may be a tall ask for many. Some have suggested it unachievable unless applied in a controlled environment where all sugar containing foods are banned. So let’s look at the facts and the plans now in place for achieving this.
Current sugar intakes exceed the old DRV recommendations of no more than 10% energy. Adults were not far off at 11.5%, the issue was with young children and teens with intakes of 14.7% and 15.4% of energy intake respectively. With the new guidelines, we are expecting adults to be able to reduce their sugar intakes by over half and children and teens by three-quarters…that does seem like a tall ask.
Which are the main culprits?
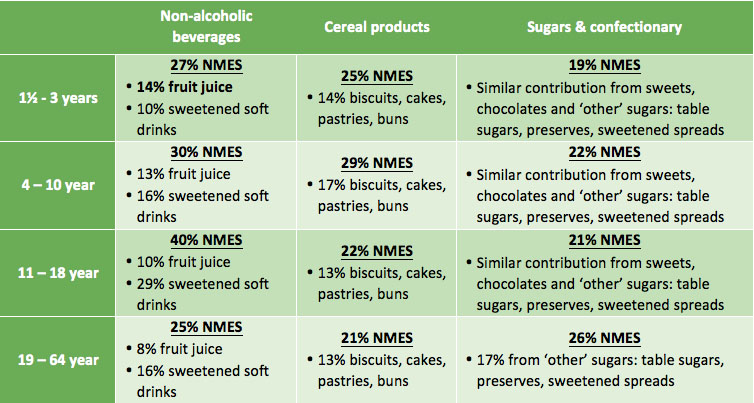
Food contribution to Non-Milk Extrinsic Sugar (NMES) intakes

Source: National Diet and Nutrition Survey Results from Years 1, 2, 3 and 4 (combined) of the Rolling Programme (2008/2009 – 2011/2012)
Not surprisingly soft drinks are the major contributors to sugar. Other unsurprising contributors are biscuits, cakes, pastries, buns plus obvious sugar and confectionary sources. Surprisingly however, fruit juice is also a key contributor, particularly for the very young. Some health professionals in the past have criticised attacks on fruit juice as it can help contribute to the nation’s 5-a-day. Fruit juice does have a halo effect for contributing to the UK’s vitamin intakes. According to the latest NDNS data, fruit juice contributes towards 14-19% of vitamin C intakes for 4-18 year olds and 12% for adults. However, soft drinks such as energy drinks, cordials and fruit drinks, contribute similar amounts of vitamin C – 18-20%. Whole fruit and vegetables remain top vitamin C contributors. Apart from the vitamin C contribution, fruit juice is not a significant contributor of any other vitamins or minerals, nor is it a source of fibre – a common myth (smoothies would on the other hand contribute to fibre intake). In addition, it’s interesting to note that vitamin C in bought fruit juice is due to fortification and not naturally derived from the fruit source. Based on these facts, soft drinks and fruit juice are not dissimilar, in that they are both a liquid form of concentrated sugar and contribute up to a fifth of vitamin C intakes.
PHE report on a rapid review of the evidence to assess the relationship between fruit juice consumption and health including cardiovascular disease. It reports that the very limited evidence shows no benefit or no harm. However, shouldn’t a review now consider the nutritional composition of fruit juice and its contribution to nutrient intake? This doesn’t appear to have been included. PHE report on how advice has been strengthened to limit consumption of fruit juice to no more than one portion a day i.e. 150ml. However, if 150ml of fruit juice is adhered to, which is highly unlikely given that only 1% of the population currently meet healthy eating guidelines, this in itself will provide approx. three teaspoons of sugar, making up 60% of the recommended maximum free sugars for 4-6 years and 50% in those 7-10 years. A more detailed review of advice in relation to fruit juice seems warranted, particularly in relation to children’s diets.
How can the nation so drastically lower their sugar intakes?
How the government aims to achieve this is through 8 key strategies, published by the PHE on the 22nd October 2015:
- Reduce price promotions on high sugar drinks and foods (in all retail and out of home sections including supermarkets, convenience stores, restaurants, cafes and takeaways).
- Significantly reduce opportunities to market and advertise high sugar food and drink products to children and adults across all media including digital platforms and through sponsorship.
- Set a clear definition for high sugar foods to aid with actions 1 and 2 above. They aim to review and update the 2011 Ofcom nutrient profiling model5.
- Gradual sugar reduction in everyday food and drink products, combined with reductions in portion size.
- The sugar tax. A price increase of a minimum of 10-20% on high sugar products through the use of a tax or levy such as on full sugar soft drinks.
- Government buying standards for food and catering services (GBSF) across the public sector, including national and local government and the NHS to ensure provision and sale of healthier food and drinks in hospitals, leisure centres etc.
- Accredited training in diet and health for all who have opportunity to influence food choices in the catering, fitness and leisure sectors and others within local authorities.
- Continue to raise awareness of sugar to the public as well as health professionals, employers, the food industry etc., encourage action to reduce intakes and provide practical steps to help people lower their own and their families’ sugar intake.
Much of the above makes sense and we look forward to seeing how all of this will be actioned. It comes as no surprise that no single action will be effective in reducing sugar intakes and it’s positive to see much direction for change in terms of the environmental drivers of poor diets. In the meantime we have a number of initial thoughts.
PHE in their report highlight the lack of evidence for a sugar tax where many experts do not support this as an effective strategy. Food tax has failed in some countries where there is limited data for success in others. Placing a 10-20% tax on a cheap commodity such as soft drinks, would surely have little impact on sales where many individuals will simply seek out cheaper own brand alternatives.
While we don’t believe a sugar tax in itself will change sugar intake, any revenue generated from the tax could be put into other actions on reducing sugar intake. However, the halo effect from the extensive media headlines on sugar tax may have in itself already started to impact on inspiring lower sugar food choices. We all know the impact of “celebrity”. However the end impact is rarely positive when it comes to celebrity and public health nutrition. It’s not surprising that Jamie Oliver is once more being regarded as a public health nutrition “angel”.
Banning advertising of sweetened foods and drinks should have come in a long time ago. We know how powerful this tool is, especially for confusing the public with ‘skewed’ health and nutrition claims that seem to by-pass current legislation.
What’s missing?
What could be lacking from the government’s 8-point strategy, is the inclusion of more ‘enforced nudging strategies’ in all retail and out-of-home outlets selling sugary drinks and foods at point of purchase and in areas where there is the highest consumption. Removing high sugar foods and drinks from end of aisles and till points are mentioned. However, very little weight is given to this in the summary, despite that fact that this strategy has been proven to work in many scenarios both in the UK and abroad. Many corner shops and out-of-home food establishments have a limited range of ‘sugar free’ drink variants, bottled water is often highly priced, and point of purchase is often adorned with high sugar / fat /salt snacks and in some well-known establishments, 500g chocolate bars are aggressively promoted.
Another dichotomy is the drive for industry sugar reductions within major sugar contributors such as confectionary, cakes, biscuits and sweetened drinks. While this is needed as an immediate and realistic solution (changing peoples’ behaviour and eating habits will take a number of generations!), on its own, it cannot help towards improving the overall dietary and lifestyle habits of individuals. Swapping like with like will not educate or help change behaviour to enjoy and consume sugar / high fat foods in moderation nor can it empower the most in need to increase fruit and vegetable, water, wholegrains, oil-rich fish and plant-based protein intakes and be more physically active. This is an important factor that needs to be incorporated into any responsible reformulation programme and subsequent communication plans.
There are of course a number of challenges associated with removing sugar from a food or drink product and there little mention of this in the report. Positively industry have already been reformulating and achieving significant reductions in the sugar content of foods and drinks already, particularly in relation to retail own brands. A range of solutions have been employed which include the use of high intensity sweeteners, some bulking agents alongside some fibres. Adding fibre successfully provides a big opportunity for businesses and public health where the population are not eating enough fibre and where SACN has recently recommended increases in daily intakes. These of course all come with various challenges which need to be considered in full before embarking on re-formulation. The use of sweeteners for example are tightly regulated at EU level. There are restrictions for use on some sweeteners in some food groups. Claims in relation to sugar reduction are also tightly regulated. Importantly the other challenge is to reformulate in ways that still deliver on the consumer expectation for taste. A challenge for all industry members and particularly medium and start-up companies of course will be cost of re-formulation.
Competent training in diet and health for the wider workforce has been hugely welcomed at Nutrilicious. This is a key passion and area of work for us. The power of many occupations and individuals to influence the diet and health of those they have contact with is enormous. Yet many lack training. Guidance on how to achieve this is mentioned but one of the key stumbling blocks for most which is funding is not addressed in this report.
Something we feel PHE failed to tackle, possibly due to the enormity of the task, is food labelling. Regulations and guidance for front and back of pack labelling stipulates that ‘Total’ sugar must be shown. There are justifiable technical reasons for this. With the increase of front of pack traffic light labelling and encouragement of its use by the government, this is bound to thwart any attempts by individuals to fully grasp which sugars they should be avoiding and more importantly, the importance of nutrient dense foods. Focusing on just sugar content on food labels, the consumer could not be blamed for choosing digestive biscuits over an individual portion of nuts and raisins. The former would be traffic light coded amber for sugar and display 17.5g sugar per 100g (or 4.6g per 2 biscuits) whilst a 25g nuts and raisins pack would be traffic light coded red for sugar and display 34g sugar per 100g (8.5g per serve). How are we helping the consumer understand that the latter will not contribute to ‘free sugars’ and more importantly, it would help towards meeting the new increased fibre recommendations, provide heart healthy fats and some minerals. How confusing can it be for a consumer to see plain dairy yogurt with amber traffic light for sugar at 7.5g per 100g. Is there now a real need for the UK to adopt front of pack traffic light labelling for sugar to only include added sugar?
Focusing more on positive messages about foods rather than individual nutrients must be a major part of the way forward. And to drive positive food choices, it would be paramount to make naturally healthier foods more attractive and readily available whilst reducing the shelf space in stores of highly processed high sugar and fat foods with little other nutritive value.
Driving healthy food choices involves nudging people in the right direction as well as helping them to learn how to achieve a healthy balanced relationship with all foods and drinks (not nutrients). All stakeholders across multiple sectors and channels can play their own unique role in this and its exciting times for those developing and creating new food and health strategies and engagement plans for better health and business.
While lots of thoughts questions and ideas abound, we welcome PHEs report on sugar reduction. We look forward to working with relevant partners in contributing to the action and seeing how all of this will be implemented and monitored so that the 5% target can be achieved in 10 years.
At this date PHE have kindly agreed for us to interview them in January 2016 about this report and we look forward to exploring our thoughts and questions further on this hot public health strategy.
https://www.gov.uk/government/publications/sugar-reduction-from-evidence-into-action