by Tanya HAFFNER | Jun 13, 2017 | Media in context
The study
A recent publication in the American Journal of clinical nutrition presents the results of a study on the dietary intake of cow’s milk and non-cow’s milk beverages in children aged 24-72 months. The authors conclude that non-cow’s milk consumption is associated with lower childhood height.
http://ajcn.nutrition.org/content/early/2017/06/07/ajcn.117.156877.abstract
Our review
There are multiple issues with the methodology used in this study that cast doubt on the value of its results and conclusions.
• The paper compares 4,632 cow’s milk drinkers with 643 non-cow’s milk drinkers. However, within these two groups there are 397 children consuming both cow and non-cow’s milk, meaning that only 4.8% (246) children in the study consume only non-cow’s milk.
o Additionally, data from the children consuming both cow’s and non-cow’s beverages are included in both groups and therefore the data are counted twice in the analysis.
• Non-cow’s milk is defined as any other type of milk not based on cow’s milk and included both plant and animal beverages e.g. goat’s milk, alongside soya and nut beverages which all have very different nutritional values. Additionally, many plant-based beverages are now fortified with vitamins and minerals. The authors therefore are completely unware of the nutritional values of the non-cow’s milk beverages and for the plant-based varieties, whether or not they were fortified nor can they make any connection between the groups for the quality and quantity of protein.
• The authors did not take other dietary factors into account. They propose that one of the key reasons why cow’s milk is important for height is achieving adequate protein intakes. Yet, without a full dietary analysis, they cannot be aware which children met their protein requirements and which did not. There are also many other protein sources in young children’s diets.
• The authors only adjusted data for maternal height but not for paternal height. The height of both parents should have been taken into account.
• The only dietary intake collected was how many 250ml cups of cow’s milk or non-cow’s milk was consumed per day. This was undertaken by questionnaire, which may be subject to measurement error or recall bias.
• It is not known when the children started consuming the non-cow’s milk drinks, or why they were consuming non-cow’s milk, both of which could have a significant effect on the results observed.
• The authors also recognise a potential height measurement error given the young age of the children.
• Finally, it is a cross-sectional study, not designed to look for causal effect, and thus the simplistic conclusion that height is effected by milk type cannot be drawn.
Our key take outs
Overall, the study is misleading and no conclusions can be drawn except that it is important for parents to be educated on children’s nutrition. Parents of children wishing or needing to avoid cow’s milk should seek dietetic advice to ensure that suitable alternatives are used and the nutritional quality of their overall diet is balanced. There is no reason why a healthy child following a balanced diet should not include calcium and vitamin fortified plant-based beverages. Additionally, soya beverages are similar to cow’s milk for protein quality and quantity.
About Nutrilicious
At Nutrilicious we help to change the way people eat for better health and planet. We do this by helping organisations and health influencers including the media with nutrition and health advice and support. We love good science and credible creative news and headlines. We get a little upset however when they mislead or cause confusion.
Our nutrition professionals are either Registered Dietitians or Registered Nutritionists with at least a bachelor’s degree in dietetic or nutrition science and extensive experience in public health nutrition. They are bound by the Association for Nutrition and the British Dietetic Association respectively to continue professional development and follow standards of ethics, conduct and performance. This means you can be assured that our advice will always be up to date with the latest recommended guidance and practice.
by Tanya HAFFNER | Dec 6, 2016 | Legal issues, Media in context, The Nation’s Health
How much is the UK public willing to pay for sweetened soft drinks?
The draft Finance Bill 2017 was published on Monday, 5th December. Not normally associated with health and nutrition news, this year, the introduction of the soft drinks levy has definitely hit the newspaper headlines. Still awaiting the finer details, the draft does provide further insight and confirms the details announced during the 2016 budget announcement. Out for comment, it will be interesting to see how industry reacts with many of the big players already making huge reformulation changes to ensure the few of their products are taxable.
So what is in the draft Finance bill?
All soft drinks which contain 5g or more of added sugars per 100ml will be in scope of the tax. This will also include alcoholic drinks of ABV up to 1.2%.
The exemptions:
• Smallest manufacturers and importers of the smallest producers abroad.
• Soft drinks containing less than 5g added sugars per 100ml or no added sugars drinks.
• Drinks classified as ‘Foods for Special Groups’ which includes baby foods and formulae.
• Sugar containing milk-based drinks with a minimum of 75ml of milk per 100ml.
• The new trend of plant-based milk alternatives is also exempt as long as they are a source of calcium.
• Alcohol substitute drinks.
Transition period until April 2018 – providing reformulation time for all industry.
The two sugar thresholds still remain:
Products with 5-8g added sugars will be taxed at a lower level than those providing 8g or more of added sugar per 100ml.
The exact tax level has yet to be defined, but according to the Guardian Monday 5 December headlines, the levy would increase the cost of a 1L bottle of soft drink containing 5g sugar per 100ml by 18p and those containing 8g and more of sugar per 100ml by 24p.
Policy objective is to reduce childhood obesity through the reduction of total calories by removing additionally calories consumed via added sugars within soft drinks. It hopes to raise in excess of £500 million in the first year which they have promised to invest in physical activity for children.
The government wants to encourage industry to reduce sugar levels by:
• Reformulation
• Reduction in portion size
• Import of lower sugars / reformulated drinks
Economic impact (Estimated by the Office for Budget Responsibility). Based on estimates made in 2016:
The levy will add a quarter of a percentage point to CPI growth in 2018 and 2019.
Health impact.
It is believed that the health of the nation will be significantly improved especially with a reduction of obesity related diseases e.g. diabetes type 2.
The main reason for the sugar focus is that it is seen as additional excess calories.
Impact on industry.
The government believes that 300 UK producers will need to register for the levy and the impact on their business should be negligible. However, the Coca Cola representative’s view at the All Party Parliamentary Group on Adult & Childhood Obesity Meeting on the 5th December, had a different opinion stating that the average cost per reformulation was in the range of £½million and that smaller manufacturers would not be able to absorb this cost.
Operational impact (HMRC costs): there will be a one-off capital costs to develop the system for tax collection and on-going resources costs for HMRC to implement this change and monitor compliance.
An additional comment made by at the All Party Parliamentary Group on Adult & Childhood Obesity Meeting on the 5th December, was that the government had yet to demonstrate clearly if this sugar tax will have a significant impact on obesity.
by Tanya HAFFNER | Jun 12, 2016 | Hot Topics in nutrition, Thoughts, Media in context
The latest headlines have been fueled by the ill-advised national obesity forum publication ‘Eat fat, cut the carbs and avoid Snacking to reverse obesity and type 2 diabetes” (23rd May) and the findings from diabetes.co.uk survey of its 80,000 diabetic patients undertaking a 10-week low carb programme (31st May).
It is always important to challenge current thinking and explore new research. It is however, highly irresponsible to debate current thinking using studies that have already been discredited for methodological flaws. Add to which, in our opinion, it’s also unhelpful and damaging to design and direct a debate around controversial research findings for the consumer arena. Unless of course, we expect consumers to be totally adept at interpreting research findings into context of public health and able to fully understand and critique statistics and methodologies. This is unlikely when we consider that not all expert health professionals are able to correctly interpret research data into context nor have the skills to grasp appropriate selection criteria, dietary methodologies and limitations of study findings.
Low saturated fat debate – based on the same bad science
It was very disappointing to see the NOF cite the same studies that have been discredited in the past for methodological flaws and study selection bias. Their conclusions that lowering saturated fat intakes has no correlation to cholesterol levels or CVD outcome does not only go against the totality of scientific evidence but demonstrates their experts lack of knowledge in the critiquing of published data. Obvious factors such as the presence of trans fats from polyunsaturated margarines, the overall macronutrient profile of diets and which macronutrient replaced saturated fat reductions in the intervention groups were completely ignored in the studies cited by the NOF. These are very basic and undisputed factors that impact on CVD and serum cholesterol outcomes. An excellent explanation has been published by Dr Nita Forouhi from the University of Cambridge and covered by Prof. Bruce Griffin from University of Surrey during the Alpro Foundation symposium in March this year.
The totality of evidence points to:
• We should be talking about foods and diet and not individual nutrients.
o I.e. saturated fat sources from dairy do not adversely affect serum cholesterol levels compared to saturated fat from processed meat. Therefore, advice to consumers should be to eat less processed meats and not to eat less saturated fats.
• Lowering saturated fat intakes is important for reducing serum cholesterol levels, however, it isn’t enough. Which macronutrient replaces the saturated fat energy is important with polyunsaturated fats proving most effective whilst refined carbohydrates will show no benefit and in some cases negative effect.
• Whole diet approach should be encouraged where higher soluble fibre wholegrains, beans and peas, fruit and veg, oil rich fish and lean proteins are encouraged. It is the nutritional profile of the whole diet that will impact on CVD outcomes.
• Meta-analysis are not full proof and their conclusions should never be taken at face value. It is important to have a full understanding of the selection criteria used and potential contraindications that have been missed.
Low carbohydrate diets and type 2 diabetes
This has been fuelled by the patient led forum at diabetes.co.uk where it encourages its subscribers (over 120,000 patients with diabetes) to embark on a low carb 10-week programme. This has been championed by Dr Unwin, a GP from Southampton, who was frustrated at the lack of weight loss and poor glycaemic control of his type 2 DM patients following traditional dietary advice. He embarked on prescribing the low carb diet and has found that his patients are sticking to the dietary regimen, losing weight and significantly improving their HbA1c readings with significant financial savings to his practice. He has published two papers, one with 19 subjects and the other based on a case study. The low carb diet recommends anything from 0-130g of carbohydrates a day – normally no more than 100g – and a higher vegetable intake with lower fruit intake. To put it into context, 100g carbohydrate equates to 5 thick slices bread, 4½ medium bananas, 4 small servings (30g) of cornflakes OR 1¾ medium jacket potatoes. Carbohydrate calories are replaced, in the main, by unsaturated fats but also from proteins. Studies published on the success of this regimen are often small in number and over a short period of approx. 3 months. However, they are promising and seem to support the high protein satiety theory and better compliance to dietary restrictions. Ultimately, individuals on these regimens do consume significantly fewer calories. Although this dietary regimen can be successful for some patients, so have other regimens been proven to be as successful including higher wholegrain and low fat diets.
The primary goal for type 2 diabetes is weight loss to help optimise glucose control, therefore, dietary regimens should be matched to the individual patient’s needs. Different approaches will work for different individuals.
by Nutrilicious | Dec 11, 2015 | Media in context, The Nation’s Health
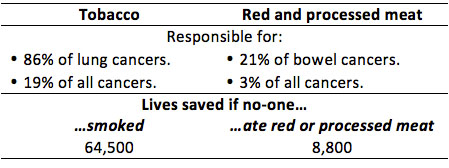
The media loves a good headline, and the World Health Organisation (WHO) and the International Agency for Research on Cancer (IARC) provided the perfect story on October 26th – processed meat causes cancer. So is bacon the new tobacco?
The review of over 800 studies found conclusive evidence that processed meats cause colorectal cancer, placing them into the AICR’s top category for carcinogenic substances alongside tobacco. Strong associations were also found for stomach cancer. Red meat was classified as ‘probably causing’ colorectal cancer with the working group unable to exclude all other confounding factors from the data available.
So, are sausages and bacon as bad for us as smoking? Comparing the lowest with the highest consumers, the evidence concluded that for every 50g of processed meat consumed a day, the relative risk of colorectal cancer increased by 18% and for every 100g of red meat consumed daily, the risk increased by 17%.
However, when the findings are put into perspective, it is clear that the level of damage caused by smoking is far greater. The IARC, highlights that their findings and risk categories reflect how strong the scientific evidence is for a substance to cause cancer rather than how many incidences of cancer it will actually cause.
Cancer Research UK’s (CRUK) blog on this topic puts things into perspective:
- 61 out of 1,000 people are expected to develop bowel cancer.
- For the lowest meat consumers, this risk will be lower, at around 56 per 1,000.
- For processed meat consumers with a 17% increased relative risk, the incidence would therefore be 66 per 1,000, i.e. 10 more cases per 1,000 for processed vs. non-processed meat consumers.
CRUK went on to put the risk in more real terms.
It’s not about the quality of the meat – it’s all in the cooking or processing technique! The mechanism by which red meat and processed meat cause cancer is still being investigated. However, the current evidence points towards the method of processing and cooking as key drivers for production of carcinogens and there seems little impact with regard to the quality or cut of meat. Processed meats include ancient traditions of smoking, curing and salting as well as any other process to enhance the flavour or shelf life of meat. Included in this category are ham, sausages, bacon, tinned meat and sausages. It is thought that the processing results in the formation of carcinogens within the meat such as N-nitroso-compounds (NOC) and polycyclic aromatic hydrocarbons (PAH).
Get the slow cooker out to help reduce cancer risk! For red meat, which includes pork, beef, lamb and goat, it is the cooking of the meat that seems to generate carcinogenic compounds such as heterocyclic aromatic amines (HAA) and PAH. And these carcinogens like higher temperatures such as those produced during pan frying, grilling and barbecuing.
So how much is too much? On this, there is less clarity as the evidence did not indicate to a ‘safe’ level. CRUK recommends following the current guidelines of no more than 70g red meat per day, avoid processed meat and to use more plant-based protein foods to part or fully replace meat dishes.
How much processed and red meat is the UK currently eating? According to the NDNS data, men eat an average of 86g per day and women 56g. However, there is a significant range from zero for non-meat eaters up to 219g daily for some men. Focusing on the higher processed meat consumers and identifying effective behaviour change strategies seems to be key.
What should our advice be to consumers? Although the Atkin’s supporters may be a little displeased, the average consumer and the press cannot blame scientists and health professionals for always changing their minds. The advice is the same as always…a varied balanced diet, cutting down on red meat and trying to avoid processed meat.
References
- Chan DSM, Lau R, Aune D et al. Red and processed meat and colorectal cancer incidence: meta-analysis of prospective studies. PLoS ONE 6(6): e20456. doi:10.1371/journal.pone.0020456. http://journals.plos.org/plosone/article?id=10.1371/journal.pone.0020456 accessed 5th Nov.
- Bouvard V, Loomis D, Guyton KZ et al. (International Agency for Research on Cancer Monograph Working Group). Carcinogenicity of consumption of red and processed meat. Lancet Oncol. 2015 Oct 23. pii: S1470-2045(15)00444-1. doi: 10.1016/S1470-2045(15)00444-1. [Epub ahead of print] http://www.thelancet.com/journals/lanonc/article/PIIS1470-2045(15)00444-1/abstract Accessed 5th November.
- Dunlop C. Cancer Research UK Science Blog. Processed meat and cancer – what you need to know. 26 October 2015. http://scienceblog.cancerresearchuk.org/2015/10/26/processed-meat-and-cancer-what-you-need-to-know/ Accessed 5th November.